Article Text

Abstract
Objective To evaluate the impact of conducting all possible pooled analyses across different combinations of randomised controlled trials and endpoints.
Design Multiverse analysis, consisting of numerous pooled analyses of individual participant data.
Setting Individual patient data from 12 randomised controlled trials comparing canagliflozin treatment with placebo, shared on the Yale University Open Data Access project (https://yoda.yale.edu/) platform, up to 16 April 2021.
Participants 15 094 people with type 2 diabetes mellitus.
Main outcome measures Pooled analyses estimated changes in serum glycated haemoglobin (HbA1c), major adverse cardiovascular events, and serious adverse events at weeks 12, 18, 26, and 52. The distribution of effect estimates was calculated for all possible combinations, and the direction and magnitude of the first and 99th centiles of effect estimates were compared.
Results Across 16 332 distinct pooled analyses comparing canagliflozin with placebo for changes in HbA1c, standardised effect estimates were in favour of canagliflozin treatment at both the first centile (−0.75%) and 99th centile (−0.48%); 15 994 (97.93%) analyses showed significant results (P<0.05) in favour of canagliflozin. For major adverse cardiovascular events, estimated hazard ratios were 0.20 at the first centile and 0.90 at the 99th centile; 2705 of 8144 analyses (33.21%) were significant, all of which were in favour of canagliflozin treatment. For serious adverse events, estimated hazard ratios were 0.59 at the first centile and 1.14 at the 99th centile; 5793 of 16 332 (35.47%) analyses were significant, with 5754 in favour of canagliflozin and 39 in favour of placebo.
Conclusion Results from pooled analyses can be subject to vibration of effects and should be critically appraised, especially regarding the risk for selection and availability bias in individual participant data retrieved.
- Diabetes mellitus
- Drug therapy
- Therapeutics
- Statistics
Data availability statement
Data may be obtained from a third party and are not publicly available.
This is an open access article distributed in accordance with the Creative Commons Attribution Non Commercial (CC BY-NC 4.0) license, which permits others to distribute, remix, adapt, build upon this work non-commercially, and license their derivative works on different terms, provided the original work is properly cited, appropriate credit is given, any changes made indicated, and the use is non-commercial. See: http://creativecommons.org/licenses/by-nc/4.0/.
Statistics from Altmetric.com
What is already known on this topic
Pooled analyses (ie, non-exhaustive quantitative syntheses that pool individual participant data from several independent randomised controlled trials exploring similar research questions) are frequently used in the evaluation of new treatments, and can influence day-to-day clinical practice
However, analyses across different combinations of trials and repeated endpoint measures can lead to variability in the observed effects estimated (ie, vibration of effect)
What this study adds
After more than 16 000 pooled analyses of individual participant data from 12 randomised controlled trials comparing canagliflozin with placebo for type 2 diabetes mellitus, substantial variations were seen in the magnitude and sometimes in the direction of the effects estimated in these analyses
How this study might affect research, practice, or policy
These findings suggest that pooled analyses focusing on a subset of all available studies cannot be simply assumed the preferred method of analysis; results from pooled analyses should be critically appraised
Selection or availability bias in the individual participant data retrieved could affect the existence of vibration of effect
Introduction
Methods for synthesising evidence, such as systematic reviews and meta-analyses (SRMAs) and pooled analyses (ie, non-exhaustive quantitative syntheses that pool individual participant data (IPD) from several independent randomised controlled trials exploring similar research questions) are often considered to form the highest level of evidence to inform clinical practice and guidelines. However, in recent years, concerns have been raised about the numbers of overlapping1 and sometimes conflicting SRMAs/pooled analyses.2 In certain fields, the exponential increase in the numbers of SRMAs/pooled analyses has resulted in nearly one new SRMA/pooled analysis for every new randomised controlled trial.3 While SRMAs aim to comprehensively identify all studies in a specific area, specific concerns have been raised about pooled analyses, which—despite allowing for larger sample sizes, greater power, and more analytical options—have been described as a strategy used by pharmaceutical firms to hide negative study results by pooling their findings with those from positive studies.4
Pooled analyses often explore subgroup effects or examine new questions5 6 across different combinations of all available studies. For instance, for the antidepressant duloxetine, at least 43 published pooled analyses have been conducted, compared with only 30 published randomised controlled trials for the treatment of major depression.5 Yet an a posteriori selection of trials to be pooled can result in p hacking (ie, conducting a large number of statistical tests until some significant findings arise).5 Different analytical decisions, such as the choice and timing of outcomes, can lead to vibration of effect (ie, the extent to which an effect estimate can change across multiple distinct analyses).7 8 In particular, evidence suggest that vibration of effect resulting from different methodological and analytical choices can lead to divergent and antagonistic conclusions in meta-analyses.9 Similar reproducibility issues could arise in pooled analyses, and this question could benefit from the increasing interest in shared IPD on data sharing platforms.10
To gain a fuller understanding of the clinical implications of the different combinations of trials and repeated endpoint measures when conducting pooled analyses of IPD from randomised controlled trials, we explored the vibration of effect in pooled analyses in the field of type 2 diabetes mellitus. To date, the clinical value of drugs that reduce chronic hyperglycaemia, as measured by serum glycated haemoglobin (HbA1c), remains uncertain because of less clear effects on clinical outcomes, such as cardiovascular events.11 Canagliflozin is a drug used for glycaemic control among patients with type 2 diabetes mellitus and it has been consistently found to reduce HbA1c, a surrogate measure of diabetes control,12–14 and for which there is evidence for cardiovascular event reduction among patients at high cardiovascular risk.15 IPD from the canagliflozin company’s clinical development programme is shared on the Yale University Open Data Access (YODA) project (https://yoda.yale.edu/) platform. Using these shared IPD, our objective was to perform all possible pooled comparisons of canagliflozin with placebo in order to explore how three different outcomes change across the universe of all possible combinations of trials and endpoints. In particular, our pooled analyses estimated change in HbA1c as a surrogate measure of efficacy, in major adverse cardiovascular events as a clinical outcome measure of efficacy, and in serious adverse events as a measure of safety, at four time periods (weeks 12, 18, 26, and 52). Our hypotheses were that vibration of effect would not be observed for HbA1c, but would be observed for both major adverse cardiovascular events and serious adverse events.
Methods
Protocol, registration, and reporting
Before starting the study or receiving the data, our protocol was registered on the Open Science Framework (https://osf.io/ac9w7/; 4 August 2020). The results are presented according to the PRISMA (preferred reporting items for systematic reviews and meta-analyses) checklist.16 This study used data obtained from the YODA project, which has an agreement with Janssen Research and Development (YODA project 2020-4417).
Eligibility criteria
We included randomised controlled trials including people (aged ≥18 years) with a diagnosis of type 2 diabetes mellitus without distinction in terms of baseline body mass index or baseline HbA1c concentrations. Studies were eligible if they focused on the comparison of canagliflozin at a dose between 50 and 300 mg, with or without another active treatment, versus a placebo. Eligible trials assessed at least one outcome among the following: HbA1c, major adverse cardiovascular events over the entire study period (which could be retrieved from the serious adverse events), and serious adverse events in the double blind study period.
Search strategy, study selection process, and data retrieval
Two reviewers (HG and FN) identified and selected the studies among the randomised controlled trials for which data were available on the YODA project platform. Data access was granted on 16 April 2021. One investigator (HG) conducted data management and collection, and gathered the following information for each patient in each study from the available IPD, in accordance with a statistical analysis plan registered on the Open Science Framework on 18 May 2021 (https://osf.io/mbeu7/): patient identification number, treatment and dose received, study in which the patient was included, relative end date of follow-up (all original dates relative to individual patients have been removed from the dataset, only relative days to the inclusion are provided), any deviation from trial protocol and, study outcomes listed below.
Risk-of-bias assessment
Two independent reviewers (HG and FN) evaluated the risk of bias in each individual study and used the Cochrane Collaboration ROB2 tool for assessing risk of bias.17
Study outcomes
We explored the vibration of effect for three different outcomes: HbA1c difference from baseline (data were extracted at baseline and at weeks 12, 18, 26, and 52), time to occurrence of the first major adverse cardiovascular event, and time to occurrence of the first serious adverse event.
As defined by the International Council for Harmonisation of Technical Requirements for Pharmaceuticals for Human Use, serious adverse events are any untoward medical occurrence that results in death at any dose, is life threatening (ie, an event in which the patient was at risk of death at the time of the event; it does not refer to an event that hypothetically might have caused death if it were more severe), requires hospital admission or a prolonged existing hospital stay, results in persistent or clinically significant disability or incapacity, or is a congenital anomaly or birth defect’.18 All studies included used this definition of serious adverse events.
In most studies on diabetes, in accordance with the US Food and Drug Administration guidelines,19 major adverse cardiovascular events are defined as a combined endpoint of cardiovascular death, non-fatal infarction, and non-fatal stroke. These events were identified from the serious adverse events using a list detailed in our statistical analysis plan (online supplemental appendix 1).
Supplemental material
Assessment of vibration of effect
We computed all possible combinations of all combinations of the randomised controlled trials included, by using the formula below. HbA1c measures, major adverse cardiovascular events, and serious adverse events were analysed separately. All computations were performed for four different time points: at week 12 (or closest date), 18 (or closest date), 26 (or closest date), and 52 (or closest date). For HbA1c data, if an observation was missing at a time point (±3 weeks; except for baseline, when only measures at –3 weeks were considered), it was replaced using the last observation carried forward method.20
(Formula to determine possible trial combinations shows samples of k trials in a set of n trials.)
For each pooled analysis (defined by a given combination of individual studies and a given time point), data were pooled using a two stage IPD meta-analysis approach.21 We used a random effects model estimated via restricted maximum likelihood estimation, and derived confidence intervals using the Hartung Knapp approach. Heterogeneity was estimated using τ2.
Effect estimates were expressed in terms of mean differences for changes in HbA1c levels and hazard ratios for major adverse cardiovascular events and serious adverse events. In case of sparse events, we used the adaptation of Firth’s correction22 to compute hazard ratios. We computed the distribution of these effect estimates and their corresponding P values in all analytical scenarios. Pooled analyses were considered to be nominally significant if the effect estimate had a P value <0.05. The presence of a Janus effect was investigated by calculating the first and 99th centiles of the distribution of the effect estimates.7 A Janus effect occurs when the first and the 99th centiles of the effect estimates of pooled analyses are in the opposite direction, illustrating the presence of substantial vibration of effect.7
All analyses were performed using R (version 3.6.3). Two stage analyses were undertaken by use of he meta package23 in R24 (version 4.15-1). Adaptation of Firth’s correction was implemented using the coxphf package.25 All the code necessary to reproduce the analyses are available on the Open Science Framework (https://osf.io/z9cfb/).
Additional analyses and changes from the initial protocol
We performed a post hoc sensitivity analysis for serious adverse events by excluding all major adverse cardiovascular events from the definition of serious adverse events. We did this analysis by focusing on the serious adverse events that were not related to the outcome of major adverse cardiovascular events, which had already been explored in our analysis and which could have reflected a potential benefit of canagliflozin.
We made several minor changes to our initial protocol after receiving the data. We included patients receiving a lower dose (50 mg) than initially planned (100-300 mg) because all doses were found to be efficacious in lowering HbA1c and were in use,26 27 excluded one study that did not match our selection criteria, analysed only intention-to-treat randomised controlled trials (no per protocol analysis was reported in the study reports or in the publications), and to simplify the analysis, decided during the peer review process to rely on a two stage approach for all meta-analyses.
Patient and public involvement
Patients and the public were not involved in the design, or conduct, or reporting, or dissemination plans of this research. This is a methodological study and we had no established contacts with specific patient groups who might be involved in this project.
Results
Study selection and study characteristics
Among the 17 canagliflozin randomised controlled trials with IPD listed as available on the YODA project, 13 were judged eligible and were included in our protocol. Of these, we excluded one study after the data were received because it did not include a placebo comparator arm, which resulted in 12 eligible trials.12–15 26–32 A flowchart detailing the trial selection process is shown in online supplemental appendix 2.
Supplemental material
Among the 15 525 patients randomised in these 12 studies, we excluded 431 patients from two trials (n=65 in NCT0064227826 and n=366 in NCT0110667712) who were randomised to sitaglipin, resulting in the inclusion of 15 094 patients for analysis. For all studies, the numbers of patients randomised were consistent with the journal article except for one study (NCT01989754), which reported 5812 patients in the journal article, while 5813 randomised patients were identified in the IPD (the discrepancy in this study arose because one patient was included twice in two different sites, and the investigator retained only the first inclusion of this individual, and the two identification numbers were not available). Details of the 12 studies included are presented in table 1. The risk-of-bias assessment is presented in figure 1. The number of missing data per variable and the description of protocol deviations are detailed in the data management report registered on the Open Science Framework (https://osf.io/5kd89/) and missing HbA1c data are detailed in online supplemental appendices 3 and 4.
Supplemental material
Supplemental material
Summary of studies included. Data are number (%) of participants unless stated otherwise
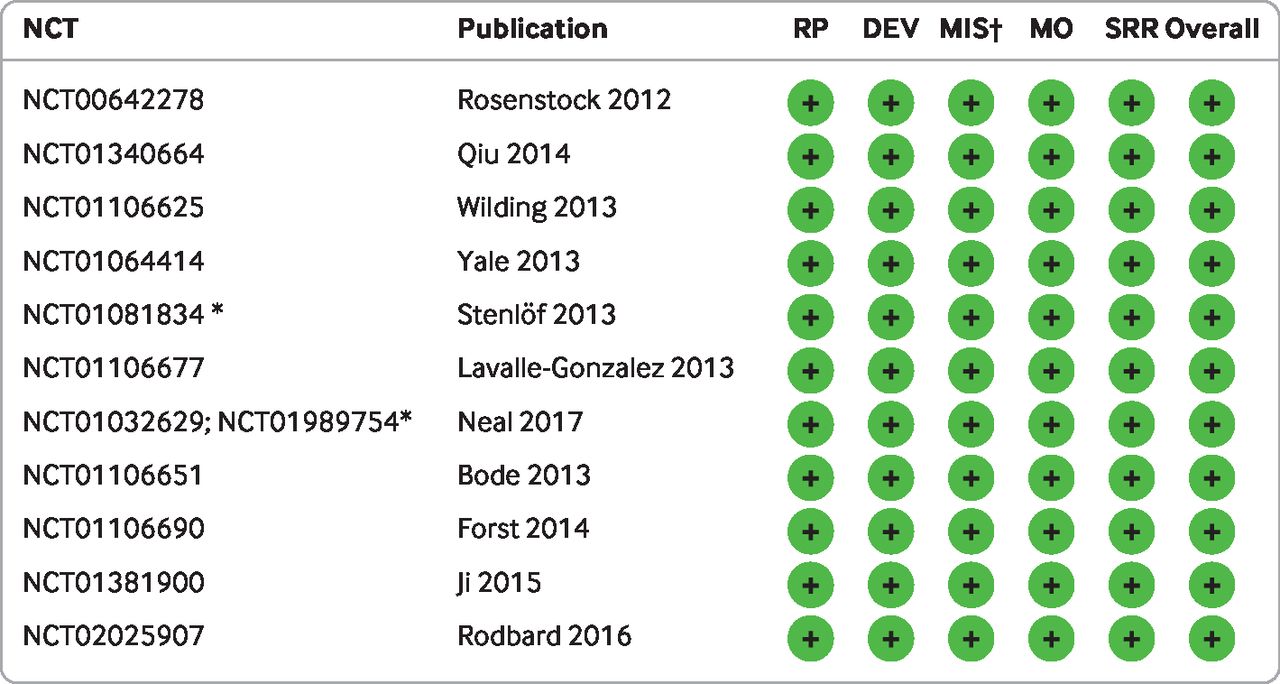
Risk-of-bias assessment. RP=randomisation process; DEV=deviations from the intended interventions; MIS=missing outcome data; MO=measurement of the outcome; SRR=selection of the reported result. Green circles with + signs indicate low risk. *For trials NCT01081834, NCT01032629, and NCT01989754, a risk of selective outcome reporting in the publication was identified, but this risk was rated low in the present analysis because all this information was available in the individual participant data. †For missing outcome data, see online supplemental appendix 4
Vibration of effect
Overall, the 12 studies resulted in 4083 different combinations of randomised controlled trials at each time point (online supplemental appendix 5) resulting in 16 332 (4×4083) different pooled analyses for HbA1c and 16 332 for serious adverse events. For major adverse cardiovascular events, we excluded one study because no events occurred, resulting in 8144 (4×2036) pooled analyses. Detailed numerical results of these analyses are presented in table 2 and a visual representation is shown in figure 2 and figure 3.
Supplemental material
Vibration of effect for comparison of canagliflozin with placebo for treatment of type 2 diabetes mellitus, by time point. Table includes numerical results for pooled analysis using all 12 studies included and for the first and 99th centiles in terms of point estimates
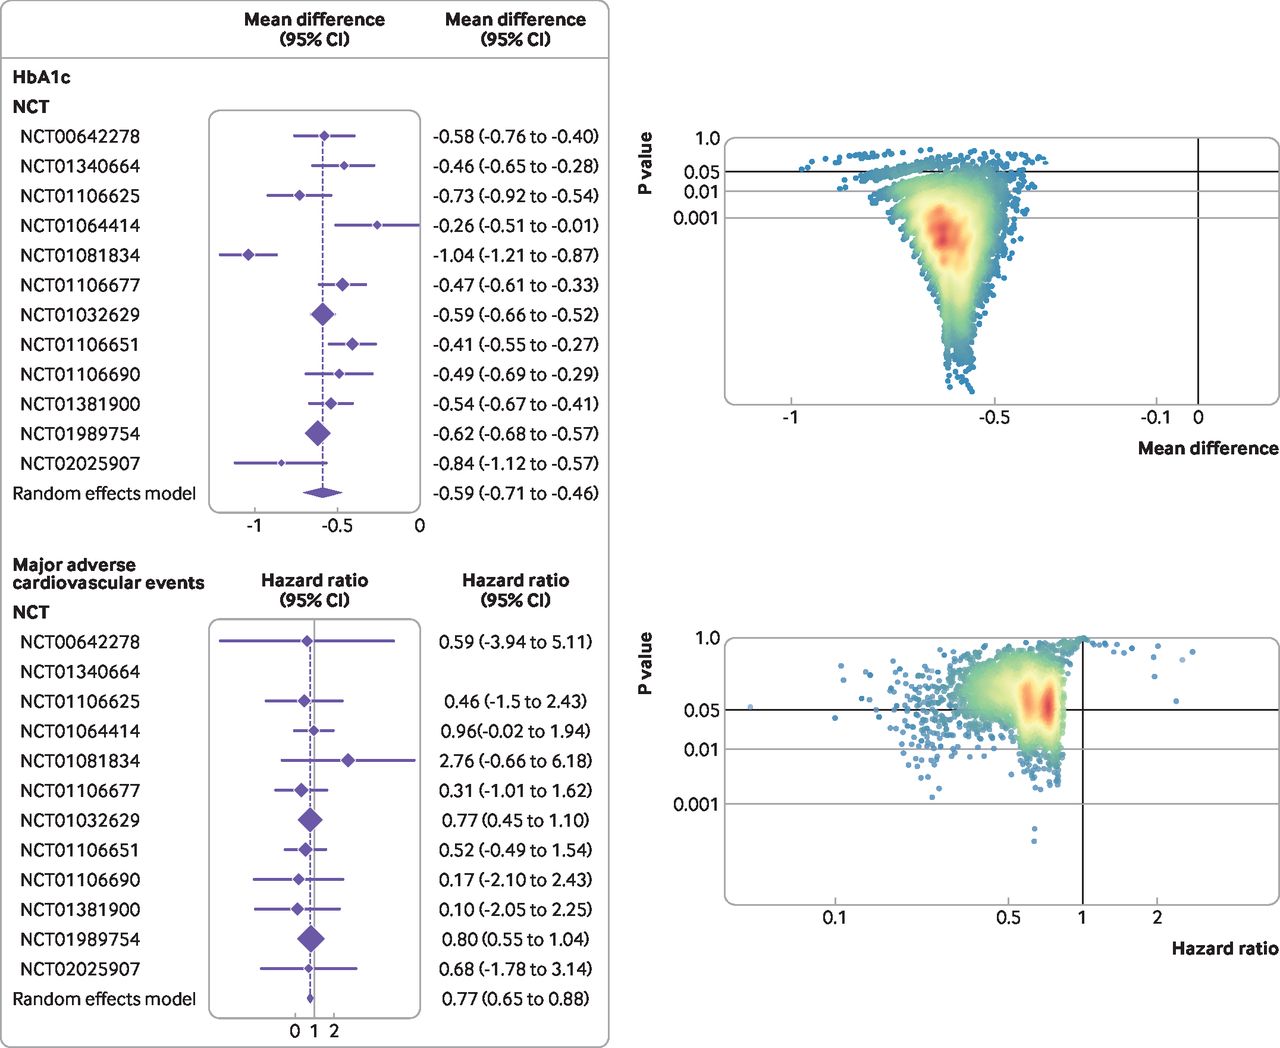
Vibration of effects for the comparison of canagliflozin with placebo for treatment of type 2 diabetes mellitus, according to haemoglobin A1c (HbA1c) difference from baseline and time to occurrence of the first major adverse cardiovascular event. For HbA1c, a negative mean difference is in favour of cangliflozin. For major adverse cardiovascular events, a hazard ratio <1 is in favour of cangliflozin. In the graphs on the right, dots represent meta-analyses and colours represent densities of dots (red=high; blue=low)
For the difference in HbA1c, the mean difference was −0.59% (95% confidence interval −0.71% to −46%) at 52 weeks figure 2. The distribution of the mean differences estimated ranged from −0.97% to −0.37% (range of 0.60%), with a median of −0.60% (interquartile range −0.64% to −0.57%). The effect estimates were −0.75% for the first centile and −0.48% for the 99th centile, indicating the absence of a Janus effect. In 15 994 (97.93%) pooled analyses, we observed a statistically significant superiority of canagliflozin over placebo.
For major adverse cardiovascular events, the hazard ratio was 0.75 (95% confidence interval 0.61 to 0.92) at 52 weeksfigure 2. The distribution of the hazard ratios estimated ranged from 0.05 to 2.76 (range of 2.71), with a median of 0.62 (interquartile range 0.50-0.73). Hazard ratios were 0.20 for the first centile and 0.89 for the 99th centile. Of 8144 meta-analyses, 8100 (99.46%) had hazard ratios in favour of canagliflozin (33.40% (2705/8100) were significant), and 0.54% (44/8144) of the meta-analyses had hazard ratios in favour of placebo (none was significant).
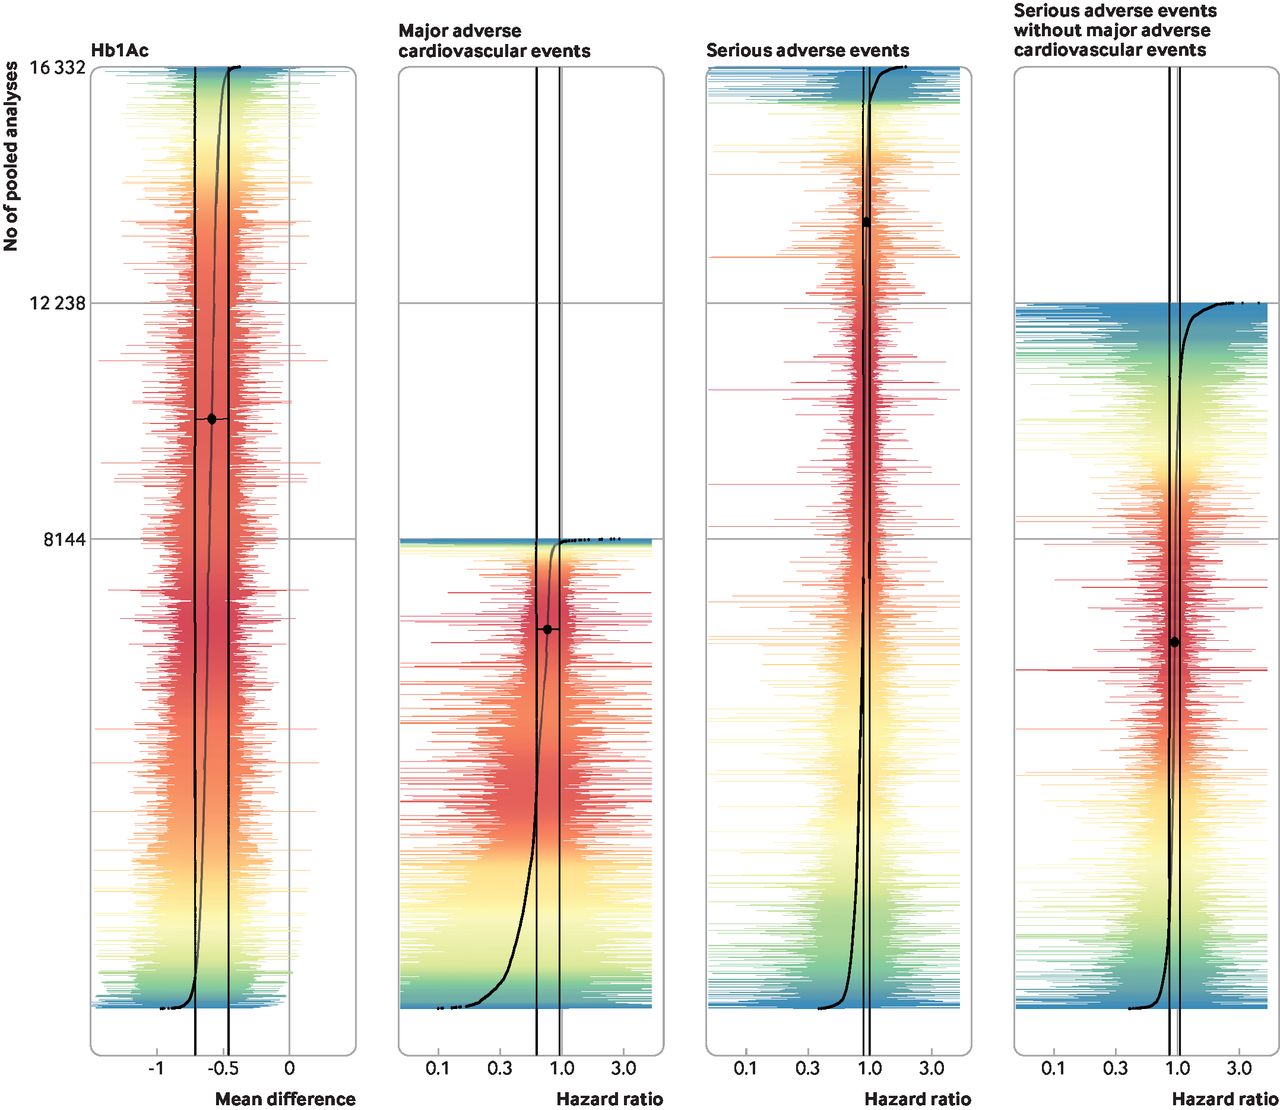
For serious adverse events, the hazard ratio was 0.91 (95% confidence interval 0.86 to 0.96) at 52 weeks figure 3. The distribution of the hazard ratios estimated ranged from 0.38 to 1.88 (range of 1.5), with a median of 0.87 (interquartile range 0.80-0.89). Hazard ratios were 0.59 for the first centile and 1.14 for the 99th centile, indicating the presence of a Janus effect. Of 16 332 meta-analyses, 15 864 (97.13%) had a hazard ratio in favour of canagliflozin (36.27% (5754/15 864) were significant), and 468 (2.87%) had a hazard ratio in favour of placebo (8.33% (39/468) were significant). Figure 4 details overlap between point estimates and confidence intervals confidence intervals for all pooled analyses.
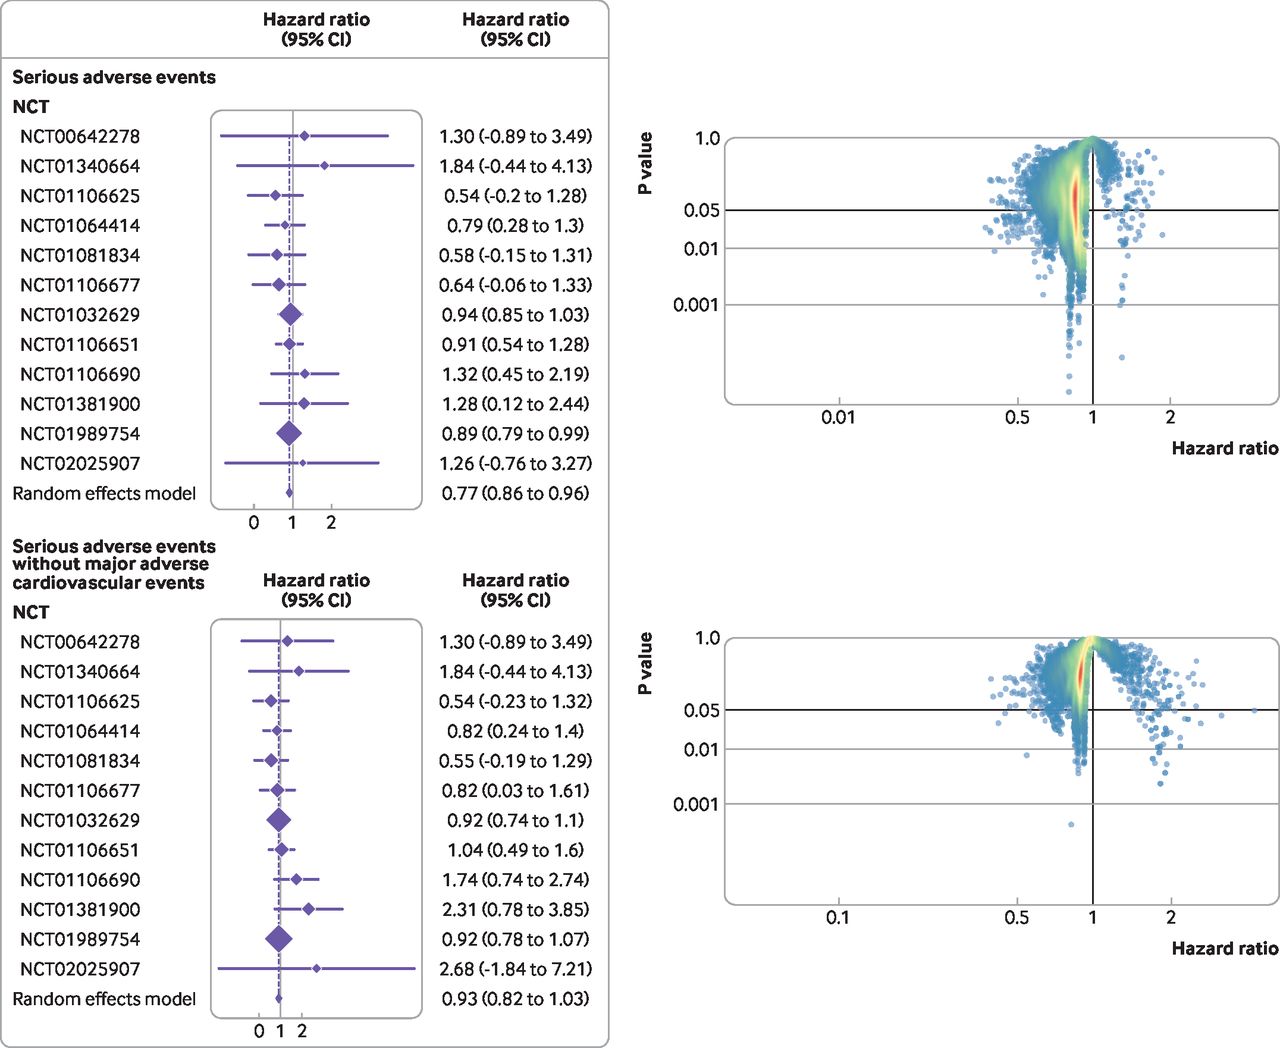
Vibration of effects for the comparison of canagliflozin with placebo for treatment of type 2 diabetes mellitus, according to time to occurrence of the first serious adverse event (with and without major adverse cardiovascular events). A hazard ratio <1 is in favour of cangliflozin. In the graphs on the right, dots represent meta-analyses and colours represent densities (red=high; blue=low).

Overlap between points estimates and 95% confidence intervals, for all pooled analyses and for the full meta-analysis (in black). Colours represent the densities of estimates (red=high; blue=low). for clarity, X axis limits were set at −1.5 to 0.5 for continuous outcomes and 0.05 to five for survival outcomes. Large central black dots and vertical lines correspond to the estimate and 95% confidence interval of the pooled analysis including the all 12 studies. Curved lines are composed of smaller points corresponding to the estimates. Coloured vertical lines correspond to the 95% confidence interval of all the pooled analyses. Full figures including extreme values are presented in online supplemental appendix 6
Supplemental material
Post hoc sensitivity analysis
The post hoc sensitivity analysis excluded major adverse cardiovascular events from the definition of serious adverse events (table 2). At weeks 12 and 18, one study was excluded because no events were observed, resulting in 2036 possible combination for these two time points and 12 238 (2×2036 + 2×4083) pooled analyses. The hazard ratio was 0.91 (95% confidence interval 0.83 to 1.01) at 52 weeks (figure 3). The distribution of the hazard ratios estimated ranged from 0.40 to 4.28 (range of 3.88), with a median of 0.91 (interquartile range 0.87-0.94). The hazard ratio was 0.66 for the first centile and 1.55 for the 99th centile, indicating the presence of a Janus effect. Of 12 238 meta-analyses, 10 802 (88.27%) had hazard ratios in favour of canagliflozin (4.01% (433/10 802) were significant) and 1436 (11.73%) had hazard ratios in favour of placebo (3.69% (53/1436) were significant). The numbers of major adverse cardiovascular events and serious adverse events per randomised controlled trial are presented in online supplemental appendix 7.
Supplemental material
Discussion
Summary of evidence
In this case study, we explored vibration of effect in more than 16 000 pooled analyses of IPD data from 12 randomised controlled trials comparing canagliflozin with placebo for type 2 diabetes mellitus. We observed no Janus effect for the mean difference in HbA1c, suggesting that the vibration of effect did not have an impact on the direction of the effect observed, although the point estimate varied considerably. Almost all the pooled analyses on this endpoint showed significant differences, which indicates that the uncertainty related to vibration of effect concerned the magnitude of the change. Nevertheless, a difference in HbA1c is controversial as a valid surrogate for macrovascular and microvascular complications in type 2 diabetes mellitus, and it is difficult to interpret in terms of clinical relevance.11 33
With respect to our analyses examining the vibration of effect on major adverse cardiovascular events, a clinically relevant outcome, we observed no Janus effect. However, the vibration of effect had an impact on the detection of canagliflozin efficacy on major adverse cardiovascular events. Regarding individual studies, efficacy on these events was identified in only one of the 12 trials included, perhaps as a consequence of lack of power, or because it was only observed in certain populations, such as patients at high cardiovascular risk. Notably, two studies that included patients with high cardiovascular risk (NCT01032629 and NCT01989754) and reported major adverse cardiovascular events as their primary outcome were pooled into one paper,15 with a significant result of the pooled analysis, but not significant for any of the individual trials. This pooled analysis was planned a priori15 and the efficacy of canagliflozin on major adverse cardiovascular events has now been robustly established in another independent study for patients with type 2 diabetes mellitus who have chronic kidney disease,34 a study for which data were not available at the time of our initial request through the YODA project.
We observed a Janus effect in our analyses examining the vibration of effect on serious adverse events. However, because these results could be confounded by the results observed for major adverse cardiovascular events, we excluded this subgroup from our definition of serious adverse events. This approach, excluding the beneficial effects of a treatment from the composite of serious adverse events, has been proposed in the field of psoriasis research.35 Results on serious adverse events were robust in this post hoc sensitivity analysis.
Vibration of effect has been suggested as a standardised method that can be used to systematically evaluate the breadth and divergence of study results,7 9 36 depending on the various methodological choices. In the context of meta-analyses, this approach is quite similar to the GOSH (graphical display of study heterogeneity) method, which was proposed for meta-analyses on aggregated data.37 We believe that a method of this type, exploring all possible subsets, makes even more sense in the context of pooled analyses, because these studies do not, by nature, exhaustively cover all existing studies. In addition, the use of IPD enabled us to explore and extract outcomes (ie, major adverse cardiovascular events and serious adverse events) that would have been difficult to extract from aggregated data, because they would not have been measured or reported in the initial publications, thus increasing the relevance of our study beyond the classic GOSH approach.
Lastly, we used a definition of the Janus effect that is only contingent on point estimates, and not on statistical significance, as in previous work.7 9 36 When looking for statistical significance, our case study very rarely identified contradictory results. Observing changes in the direction of effect estimates and occasionally in significance is to be expected because of sampling variability only. Heterogeneity, bias in some of the initial studies, and the magnitude of the effect might also affect the existence of vibration of effect and the presence of a Janus effect. However, we believe that the bigger concern for pooled analyses is the presence of selection or availability bias in the IPD used in the meta-analysis.38
Strengths and limitations of the study
The findings from our case study might not be generalisable across all fields. Firstly, we selected an example involving a large number (and therefore a large number of possible combinations) of randomised controlled trials. Identifying vibration of effect in fields with only a few trials could be more challenging. Secondly, we only considered two methodological choices—that is, study inclusion and timing of endpoints. Vibration of effect can be influenced by many other characteristics, including subgroup analyses, different definitions of outcomes (eg, a different construction of major adverse cardiovascular events), different groupings of doses, and different analytical strategies (eg, choice of one stage v two stage IPD, model specification, or different handling of missing data). Therefore, our results could in fact underestimate the vibration of effect that might have resulted from many other researchers' degrees of freedom in the analysis. However, our evaluation concerned 16 332 analyses and provides an idea of the impact of different trial combinations and repeated endpoint measures. Our choice to focus such combinations of studies was driven by the fact that many pooled analyses are run with the risk of manipulating the results, by selecting favourable combinations of studies.5 Nevertheless, subgroup analyses might be frequently conducted in pooled analyses (eg, for duloxetine5), a consideration that deserves attention in future research.
Thirdly, we relied only on studies available on the YODA platform at the time of our request. All these studies were sponsored by Janssen, and we considered that this specific subset of studies was adequately represented a sample that a given sponsor would use when conducting a series of secondary analyses. Relying on IPD from such a homogeneous subset of studies allowed the quality of studies to be better assessed, and for analyses to be standardised. Therefore, selected studies for the analysis could have less variability and less potential for vibration of effect than in the present study. We did not conduct a systematic search for other studies, for example, those conducted in an academic context. Whether the authors of academic studies would have shared the trial IPD necessary to conduct our analyses for vibration of effect is uncertain, and including studies of this type could have added heterogeneity and vibration of effect.
Implications of the findings
Our findings have several implications. Especially when performing post hoc evaluations of published trials, pooled analyses focusing on a subset of all available studies cannot be simply assumed to be the preferred method. In particular, our findings suggest that results from pooled analyses should be critically appraised. Health authorities, for instance, should not rely exclusively on findings from pooled analyses when approving treatments. Evidence suggests that findings from pooled analyses have been used to guide approvals by the European Medicine Agency,39 including that for nalmefene for alcohol use disorders.40 To enhance the quality of pooled analyses and the evidence generated by them, we suggest that pooled analyses should be planned a priori, with detailed, pre-registered study protocols, as with prospective meta-analyses.41 This step would minimise any methodological changes during the analyses that could introduce vibration of effect. If pre-registration is not possible (eg, when the researchers conducting pooled analyses are not involved in the design or conduct of the original randomised controlled trial), analytical plans should be registered before data analysis, to maintain full transparency regarding any decision made during the conduct of the study, such as the selection of studies to be pooled in the analysis. Pooled analyses should rely on IPD from studies that are representative of the target population of interest and high quality, in order to best estimate the estimands of interest. These steps will continue to be important as data sharing increases in medicine and secondary uses of this type become more popular.10 42
We think that the vibration-of-effect approach shows promise in exploring issues related with reproducibility, especially because overlapping meta-analyses with divergent conclusions are not rare in the literature.2 However, to recommend implementing the method in all IPD meta-analysis/pooled analyses would be immature. Therefore, we recommend that future research systematically explores vibration of effect in a large set of meta-analyses in order to give a better indication of its relevance. Such a study will also help to investigate associations between the vibration of effect and the Janus effect with many parameters such as heterogeneity, effect size, study quality, and random sampling.
Conclusion
In this case study, we explored the vibration of effect in more than 16 000 pooled analyses of IPD data from 12 randomised controlled trials comparing canagliflozin with placebo for treating patients with type 2 diabetes mellitus. We found substantial variations in the magnitude and, for serious adverse events, the direction of the effects estimated. These findings suggest that when conducting pooled analyses of IPD from randomised controlled trials, trial selection, analysis of subsets of all trials and their selection or availability of IPD could have considerable consequences on treatment effect estimation.
Data availability statement
Data may be obtained from a third party and are not publicly available.
Ethics approval
Not applicable.
Acknowledgments
We thank Anne Hespel and Frederic Rimattei for processing the data requests, and Sarah Verdier Leyshon and Angela Swaine Verdier for revising the paper for English. The interpretation and reporting of research using this data are solely the responsibility of the authors and do not necessarily represent the official views of the YODA Project or Janssen Research and Development.
References
Supplementary materials
Supplementary Data
This web only file has been produced by the BMJ Publishing Group from an electronic file supplied by the author(s) and has not been edited for content.
Footnotes
Twitter @JoshuaDWallach, @NaudetFlorian
Contributors FN HG conceived and designed the experiments. HG, JDW, RB, JSR, and FN validated the protocol. HG extracted and analysed the data, and wrote the first draft of the manuscript. FN and HG interpreted the results. JDW, JSR, FN, and HG contributed to the writing of the manuscript. All authors agreed with the results and conclusions of the manuscript. FN was study guarantor. The corresponding author attests that all listed authors meet authorship criteria and that no others meeting the criteria have been omitted. Transparency: The lead author (the guarantor) affirms that the manuscript is an honest, accurate, and transparent account of the study being reported; that no important aspects of the study have been omitted; and that any discrepancies from the study as planned (and, if relevant, registered) have been explained.
Funding The project was funded by the Agence Nationale de la Recherche (reference ANR-17-CE-36-0010-01). The sponsor had no role concerning the preparation, review, or approval of the manuscript.
Competing interests All authors have completed the ICMJE uniform disclosure form at www.icmje.org/disclosure-of-interest/ and declare: support from the Agence Nationale de la Recherche for the submitted work. JDW currently receives research support from the US Food and Drug Administration and the National Institute on Alcohol Abuse and Alcoholism of the National Institutes of Health under award K01AA028258. JSR currently receives research support through Yale University from Johnson and Johnson to establish the YODA project and develop methods of clinical trial data sharing; from the Medical Device Innovation Consortium as part of the National Evaluation System for Health Technology; from the FDA for the Yale-Mayo Clinic Center for Excellence in Regulatory Science and Innovation program (U01FD005938); from the Agency for Healthcare Research and Quality (R01HS022882); from the National Heart, Lung, and Blood Institute of the National Institutes of Health (R01HS025164, R01HL144644); and from the Laura and John Arnold Foundation to establish the Good Pharma Scorecard at Bioethics International; JSR is an expert witness at the request of Relator's attorneys, the Greene Law Firm, in a qui tam suit alleging violations of the False Claims Act and Anti-Kickback Statute against Biogen; JSR is an associate editor at The BMJ and an editorial board member at BMJ Medicine; he was not involved in BMJ Medicine’s handling of this manuscript.
Provenance and peer review Not commissioned; externally peer reviewed.
Supplemental material This content has been supplied by the author(s). It has not been vetted by BMJ Publishing Group Limited (BMJ) and may not have been peer-reviewed. Any opinions or recommendations discussed are solely those of the author(s) and are not endorsed by BMJ. BMJ disclaims all liability and responsibility arising from any reliance placed on the content. Where the content includes any translated material, BMJ does not warrant the accuracy and reliability of the translations (including but not limited to local regulations, clinical guidelines, terminology, drug names and drug dosages), and is not responsible for any error and/or omissions arising from translation and adaptation or otherwise.