Article Text

Abstract
Objective To develop a measure for fair inclusion in pivotal trials by assessing transparency and representation of enrolled women, older adults (aged 65 years and older), and racially and ethnically minoritized patients.
Design Retrospective cross sectional study.
Population Sponsors of novel oncology therapeutics that were approved by the US Food and Drug Administration over 1 January 2012 to 31 December 2017.
Data sources Trial data from Drugs@FDA, ClinicalTrials.gov, and corresponding publications; cancer incidence demographics from US Cancer Statistics and the American Cancer Society.
Main outcome measures Transparency measures assess whether trials publicly report participant sex, age, and racial and ethnic identity. Representation measures assess whether trial participant demographics represent more than 80% of the US patient population for studied conditions, calculated by dividing the percentage of study participants in each demographic subgroup by the percentage of the US cancer population with the studied condition per group. Composite fair inclusion measures assess average transparency and representation scores, overall and for each demographic group. Results are reported at the trial, product, and sponsor levels.
Results Between 1 January 2012 and 31 December 2017, the FDA approved 59 novel cancer therapeutics, submitted by 25 sponsors (all industry companies) on the basis of 64 pivotal trials. All 25 sponsors (100%) reported participant sex, 10 (40%) reported age, and six (24%) reported race and ethnicity. Although 14 (56%) sponsors had adequate representation of women in trials, only six (24%) adequately represented older adults, and four (16%) adequately represented racially and ethnically minoritized patients (black, Asian, Hispanic or Latinx). On overall fair inclusion, one sponsor scored 100% and the median sponsor score was 81% (interquartile range 75-87%). More than half of sponsors (13 (56%) of 25) fairly included women, 20% (n=5) fairly included older adults, and 4% (n=1) fairly included racially and ethnically minoritized patients in trials. 80% of product had pivotal trials that fairly included women, 24% fairly included older adults, and 5% fairly included racially and ethnically minoritized patients.
Conclusions This novel approach evaluates trials, products, and sponsors on their fair inclusion of demographic groups in research. For oncology trials, substantial room was noted for improved inclusion of older adults and patients who identify as black or Latinx and transparency around the number of participants identifying as Native Hawaiian, Pacific Islander, American Indian, and Alaska Native. These measures can be used by sponsors, ethics committees, among others, to set and evaluate trial diversity goals to help spur progress toward greater research equity in the US.
- clinical trial
- healthcare disparities
- health services
Data availability statement
Data are available in a public, open access repository. Extra data can be accessed via the Dryad data repository at http://datadryad.org/.44
This is an open access article distributed in accordance with the Creative Commons Attribution Non Commercial (CC BY-NC 4.0) license, which permits others to distribute, remix, adapt, build upon this work non-commercially, and license their derivative works on different terms, provided the original work is properly cited, appropriate credit is given, any changes made indicated, and the use is non-commercial. See: http://creativecommons.org/licenses/by-nc/4.0/.
Statistics from Altmetric.com
WHAT IS ALREADY KNOWN ON THIS TOPIC
Women, older adults, and racially and ethnically minoritized patients are often under-represented in clinical research even though adequate representation is important for equitably assessing the safety and efficacy of novel therapeutics in the patients who ultimately use them.
Despite policy efforts to improve diversity, poor inclusion in trials persists, suggesting additional strategies are needed.
Development of accountability measures and publicly rating and ranking sponsors might be an effective reform strategy for improving diversity and fair inclusion in research.
WHAT THIS STUDY ADDS
This paper develops baseline quality measures for fair inclusion and diversity in clinical research that capture the transparency of participant demographics and representation of women, older adults, and racially and ethnically minoritized patients.
Applying the measures to score and rank novel oncology therapeutics FDA approved from 2012 through 2017, along with their sponsors and trials, we found that while a few sponsors have done well, most have substantial room for improvement on their inclusion of older adults and racially and ethnically minoritized patients, and to a lesser extent women.
HOW THIS STUDY MIGHT AFFECT RESEARCH, PRACTICE, OR POLICY
The fair inclusion score we developed and tested on oncology pivotal trials provides a useful, feasible method of assessing critical indices of equity in clinical trials.
The fair inclusion measure can be used to track and catalyze progress across the research ecosystem on clinical trial diversity, a key public health and social justice goal.
Introduction
Demographic representation in clinical research is important for equitably assessing the safety and efficacy of novel therapeutics in the patients who will use them. However, women, older adults, and some racial and ethnic groups are often under-represented in research, particularly in cancer trials.1–4 This under-representation can challenge clinicians, payers (such as insurance companies), and patients’ abilities to apply study findings to excluded or under-represented demographic subgroups and exacerbates disparities in access to clinical research benefits.
Policy efforts to improve trial diversity span decades, with little impact. Policies include the National Institutes of Health Revitalization Act, signed into US law in 1993 and the 21st Century Cures Act.5 The US Food and Drug Administration (FDA) has also published relevant guidance,6 7 as have payers, journals,8 clinician groups,9 and various other research funders.10 The biopharmaceutical industry, which sponsors most contemporary clinical research, has also voluntarily made efforts to diversify trial participation.11 12 Pharmaceutical Research and Manufacturers of America (PhRMA), the industry’s trade group, for instance, published principles on clinical trial diversity in April 2021 for its members.13 Furthermore, some companies have established internal working groups, expanded their workforce diversity, implemented investigator training programs, and sought to choose trial sites with more diverse patient populations, all to improve demographic inclusion in their research.13
Although these efforts are important, additional strategies are needed to make an impact on diversity in trials. Studies have shown that publicly rating organizations can be an effective quality improvement strategy.14 15 Accordingly, this paper aimed to develop quality measures for clinical trial diversity and apply them to score and rank the performance of novel oncology therapeutics that were FDA approved from 2012 through 2017, along with their trials and sponsors.
Methods
Data sources
We gathered data from Drugs@FDA.gov,16 a publicly accessible database containing records of FDA regulatory decisions; publications indexed in ClinicalTrials.gov; FDA Trials Snapshots; the 2012 to 2017 US Cancer Statistics data set,17 which includes cancer registry data from the National Programme of Cancer Registries and the National Cancer Institute’s Surveillance, Epidemiology, and End Results (SEER); and the American Cancer Society (demographic data from 2021).18
Data collection
We identified all novel drugs and biologics approved by the FDA for oncological conditions between 1 January 2012 and 31 December 2017 from the Centre for Drug Evaluation and Research New Molecular Entity Drug and Original Biologic Approvals List.19 For each product, we abstracted the date of approval, New Drug Application or Biologics License Application sponsor, approved indication, and approval pathway (ie, priority review, accelerate approval, breakthrough designation, fast track, and orphan designation).
In keeping with our previously published methods,1 we identified all pivotal trials from the FDA medical review documents in the Drugs@FDA database that supported the FDA’s initial approval of each product. Studies were classified as pivotal if they were explicitly described as pivotal or if they provided evidence of efficacy or safety that was essential to FDA approval. We included pivotal trials even if they were conducted outside of the US because these trials were the basis for FDA approval of the drug in the US. We focused on pivotal trials because these trials inform FDA approval decisions and provide the foundational evidence supporting the safety and efficacy of novel therapeutics at the time of approval.
We then searched for each trial on ClinicalTrials.gov using our previously published search and matching techniques1 and extracted trial characteristics, including the sponsor, total number of participants, median or mean age of participants, and numbers of participants described by sponsors as women, older adults (65 years or older), and white, black, Asian, Hispanic or Latinx, American Indians and Alaska Natives, and Native Hawaiians and Pacific Islanders. If demographic information was not available on ClinicalTrials.gov, we searched and abstracted it from indexed publications of the clinical trial entry on ClinicalTrials.gov and FDA Snapshots.
One investigator (TV) extracted demographic data, between 16 March and 13 May 2021. A second research assistant (WP) confirmed the accuracy of our data by re-extracting a 10% sample to validate, with an agreement rate above 95%. For studies missing demographic data on ClinicalTrials.gov on 13 May 2021, we checked again on 22 November 2021 and checked FDA Snapshots again on 29 September 2022. Annual data for the demographic distribution of US patients diagnosed with each cancer type in our sample were abstracted from the 2012 to 2017 US Cancer Statistics and the American Cancer Society.17 18
Outcome measures
Transparency
We evaluated each trial on its transparency, that is, whether the sex or gender, age, and race and ethnicity of trial participants were publicly reported in ClinicalTrials.gov or indexed publications. For age, we focused on whether the percentage of older adults enrolled in a trial (people older than 64 years) and the median or mean age of participants were transparent. For race and ethnicity, we evaluated whether the percentage of participants identifying as black, Asian, and Latinx were transparent. These three racial and ethnic groups were selected because most trials and cancer incidence databases did not parse racial and ethnic data further. For each outcome measure, we assigned a 100% or 0% score, depending on whether data were publicly available.
We then calculated an overall transparency score for each trial by averaging its three parameter transparency scores: for sex, age, and race and ethnicity. If a parameter had more than one outcome measure (ie, age, has two: whether the mean or median age of trial participants was transparent and the proportion of enrolled older adults), we first averaged those outcome scores to create an overall score for that parameter (ie, for age). As an example, if the median age of trial participants was available (scoring 100% on that outcome measure), but the proportion of older adult participants was not (scoring 0% on that outcome), then the overall trial’s transparency score for age was 50% (the average of 100% and 0%) (table 1).
Summary of outcome measures and scoring system to calculate a transparency score
Representation
For each trial, we evaluated the representation of enrolled women, older adults, and racial and ethnic minorities by comparing their composition of enrolled participants to that of the US disease population by indication (table 2). This comparison was done by constructing a participation to prevalence ratio (PPR), following methods developed by Poon and colleagues.20 These ratios were calculated by dividing the percentage of a particular group in a study sample (ie, the percentage of participants in a gastric cancer study who are women) by the percentage of the particular population in the real-world US patient population (ie, the percentage of US patients with gastric cancer who are women).
Summary of outcome measures and scoring system to calculate an overall representation score
In keeping with the literature,20 a PPR of at least 0.8 was deemed to be an adequate representation and received a score of 100%. For each 0.1 below 0.8, 10 percentage points were deducted. An overall representation score was calculated for each trial by calculating the mean of its PPRs on sex, age, and race and ethnicity (table 2).
Fair inclusion
For each trial, we calculated a fair inclusion score by calculating the mean of a trial’s representation and transparency scores for women, older adults, racially and ethnically minoritized patients, and overall (online supplemental box 1). We weighted both components equally because both provide important information into who is enrolled in trials and to have representative enrollment. We are building a tool so readers can weight these two variables by interest, which we will make available on the Good Pharma Scorecard home page (https://bioethicsinternational.org/good-pharma-scorecard/).
Supplemental material
If a product was approved based on more than one pivotal trial (n=5 products), we averaged individual trial parameter scores to calculate the product level parameter scores. Parameter scores at the product level were then averaged to calculate an overall product component score.
If a company sponsored more than one product (n=14 companies), we averaged each product’s individual parameter scores to calculate company level parameter scores. Company parameter scores were then averaged to calculate company level component scores. Subsidiary companies were classified under parent companies.
Analysis
Analyses were conducted in Microsoft Excel version 15.11 and R version 3.5.1. Descriptive statistics were used to report the proportion of trials, products, and companies that meet each component, parameter, and outcome measure. Companies were then grouped into three categories by their overall fair inclusion scores: gold (those scoring in the top quarter), silver (those scoring above the median score but below the top quarter), and unrated (those scoring below the median company score).
Patient and public involvement
The objective of this paper, to develop measures of fair inclusion in clinical research, was identified and developed during a roundtable that JM organized in 2017 with patients and patient advocacy groups (participant list was previously published).21 A patient advocacy organization (Susan G Komen Foundation) then sponsored this study and is an acknowledged contributor. In June 2022, we held a 7 hour roundtable with approximately 40 individuals representing research sponsors (online supplemental box 2) on these measures, with majority if not unanimous agreement on their reasonableness and appropriateness. We will partner with Susan G Komen Foundation, patient organizations, and others in developing and executing a dissemination plan. Future plans include using these measures to evaluate, score and rate or rank sponsors annually on their fair inclusion of women, older adults, and racially and ethnically minoritized patients in clinical research along with other diversity, equity, and inclusion measures for research.
Results
Sample characteristics
Between 2012 and 2017, the FDA approved 59 novel cancer therapeutics (39 drugs and 20 biologics) sponsored by 25 biopharmaceutical companies (32 bef0re accounting for subsidiaries, mergers, and acquisitions) for 16 broad oncological indications (table 3). These therapeutics were approved on the basis of 64 pivotal trials that collectively enrolled 29 959 participants (median of 326 (interquartile range 138-668) participants per trial). The median number of pivotal trials per therapeutic was 1 (1-1). Only five therapeutics had more than one pivotal trial: abemaciclib, osimertinib, daratumumab, pomalidomide, and alectinib. An average of 2.5 products were noted per sponsor. Roche sponsored the greatest number (n=8), while half of the companies had only one product approved.
Characteristics of oncology therapeutics approved by the US Food and Drug Administration, 2012-17
Women
At the sponsor level, while all 25 companies transparently reported the sex of enrolled participants, only 56% (n=14) adequately represented women in all pivotal trials and received a 100% representation score for women, corresponding to a PPR of >0.8 (figures 1 and 2; table 4).
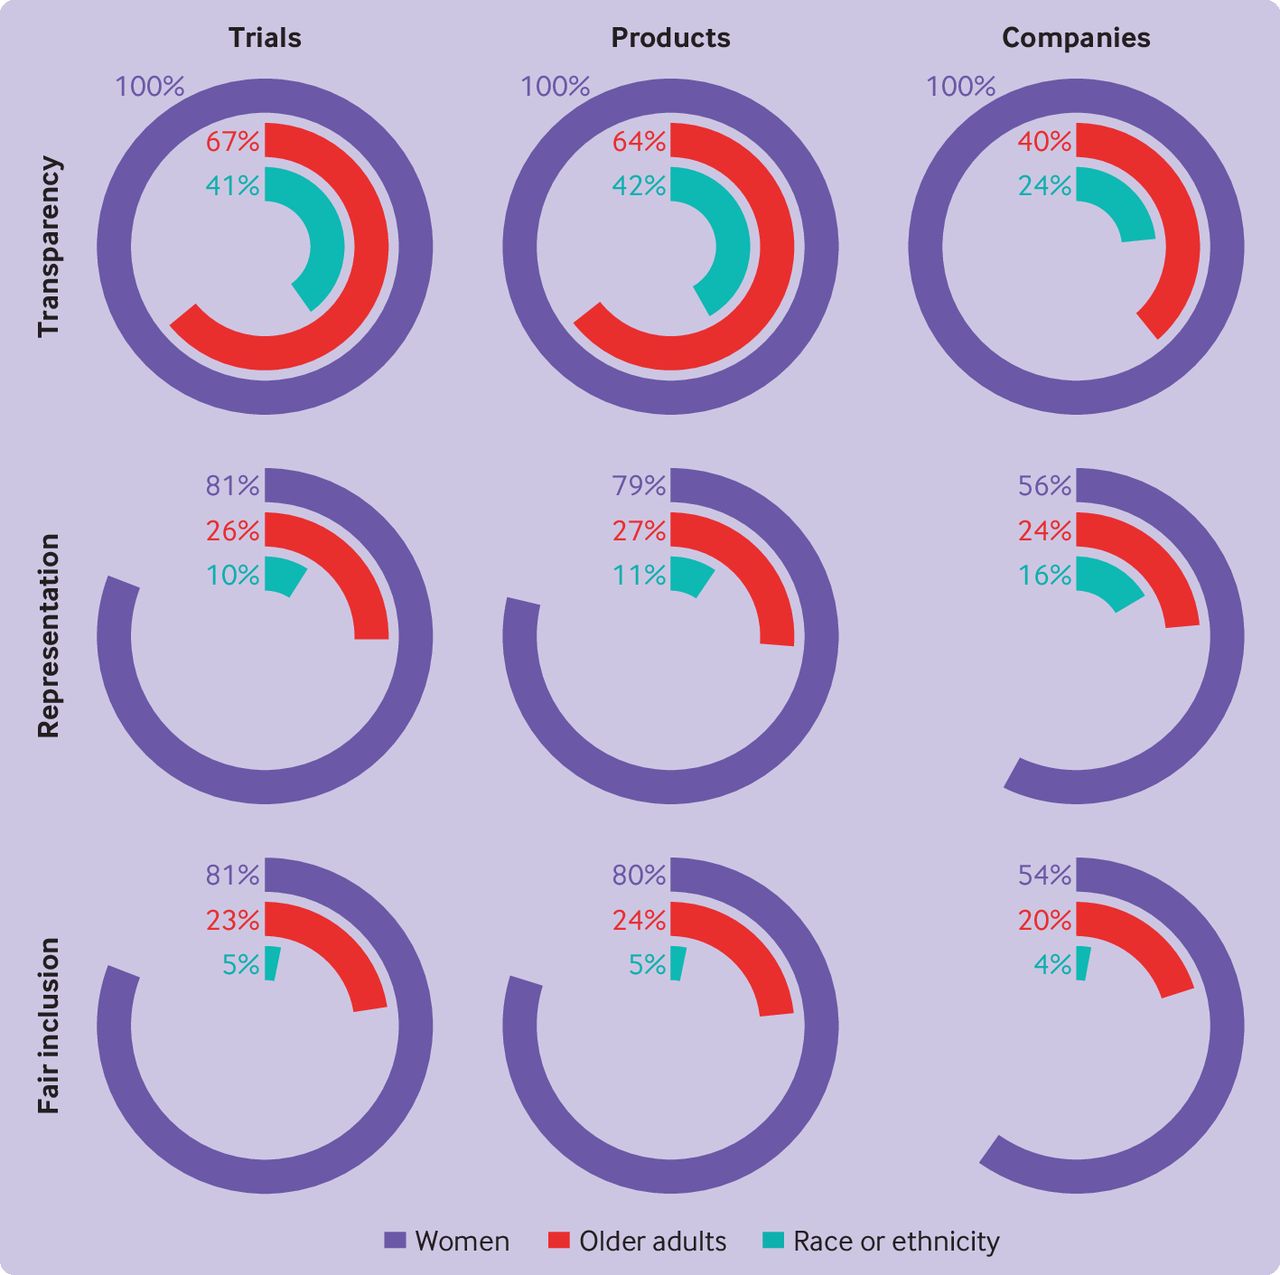
Proportion of trials, products, and companies receiving a 100% score on transparency, representation, and fair inclusion measures for women, older adults, and racially and ethnically minoritized patients participating in clinical trials for novel oncology therapeutics approved by the US Food and Drug Administration during 2012-17
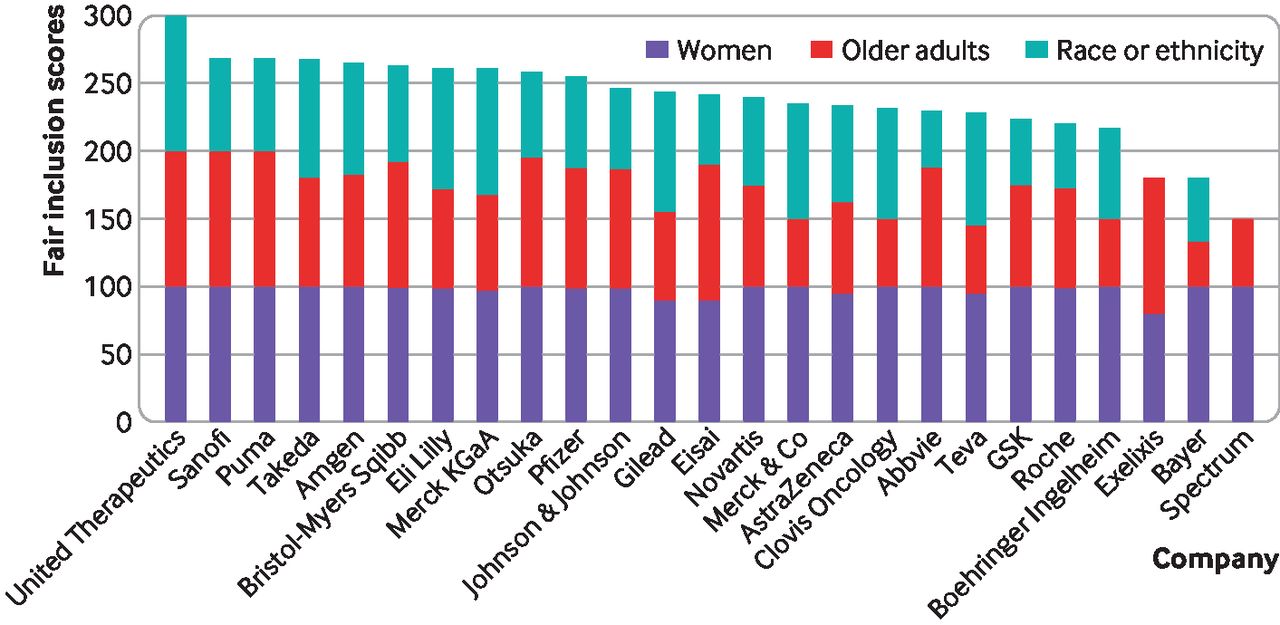
Company rankings on fair inclusion of women, older adults, and racially and ethnically minoritized patients in research, for novel oncology therapeutics approved by the US Food and Drug Administration during 2012-17. See table 4 for further information and data
Company rankings and ratings on their fair inclusion of women, older adults, and racially and ethnically minoritized patients in pivotal trials supporting their oncology drug approvals, by rating, 2012-17
At the product level, all 59 therapeutics were approved based on pivotal trials that transparently reported the sex of enrolled participants and most (79%, 45/57) were approved based on pivotal trials that adequately represented women (figure 1). We could not calculate representation scores for two trials supporting the approval of two drugs for basal cell carcinoma (vismodegib by Genentech and sonidegib by Novartis) because of an absence of reliable public data for the demographics of basal cell carcinoma patients in the US. The median product representation score for women was 100% (interquartile range 100-100%) (online supplemental table 1). Although not incorporated into our scoring, which focused on adequate representation of women, men were under-represented in participant enrollment in five of the six breast cancer trials (abemaciclib by Eli Lilly, pertuzumab and trastuzumab by Genentech, ribociclib by Novartis, palbociclib by Pfizer, and neratinib by Puma Biotech) in our sample.
At the trial level, all 64 pivotal trials transparently reported the sex of enrolled participants, and most (81%, 50/62) adequately represented women (figure 1). The median per trial representation score for women was 100% (interquartile range 100-100%) (online supplemental table 2).
Older adults
At the sponsor level, 40% (10/25) of companies transparently reported the age of participants, that is, the mean or median age of people who were enrolled and the proportion of older adults enrolled (figure 1). The median company transparency score for trial participants’ age was 83% (interquartile range 54-100%) (figure 2; table 4). A quarter of companies (24%, 6/25) adequately represented older adults in all pivotal trials supporting their product approvals (figure 1). The median sponsor representation score for older adults was 85% (interquartile range 75-100%) (figure 2; table 4).
At the product level, 64% of therapeutics (38/59) transparently reported the age of participants. Among those reporting the proportion of older adult participants, about a quarter (26%, 15/57) were approved based on pivotal trials adequately representing older adults (figure 1). We were unable to calculate the score for the two therapeutics (vismodegib and sonidegib) for the same reason as above. The median product representation score for older adults was 90% (interquartile range 60-100%) (online supplemental table 1).
At the trial level, 67% (43/64) transparently reported the age of participants; a quarter (26% (16/62)) adequately represented older adults (figure 1). We were unable to calculate representation scores for older adults for 16 trials because 13 trials provided only median or mean age of patients, one tested a therapeutic approved for neuroblastoma reported only in children (dinutuximab by United Therapeutics), and two tested therapeutics for basal cell carcinoma (vismodegib by Genentech and sonidegib by Novartis) for which data on US patient demographics are unavailable. The median trial representation score for older adults was 90% (interquartile range 60-100%)(online supplemental table 2).
Racial and ethnic inequities
At the sponsor level, 24% of companies (6/25) transparently reported the racial and ethnic identity of participants for all pivotal trials supporting their product approvals (figure 1). The median company transparency score for participants’ race and ethnicity was 67% (interquartile range 50-92)(figure 2, table 4). Only 16% (4/25) of sponsors adequately represented racially and ethnically minoritized patients in all pivotal trials supporting their product approvals (figure 1). By subgroup, 16% (4/25) of companies adequately represented black patients, 48% (12/25) Asian patients, and no companies adequately represented Latinx patients. The median company representation score for race and ethnicity was 72% (interquartile range 60-85) (figure 2; table 4).
At the product level, 42% (25/59) of therapeutics transparently reported the proportion of enrolled racially and ethnically minority participants; the median transparency product score was 67% (interquartile range 67-100%)(figure 1, online supplemental table 1). Only one product, trabectedin (by Janssen Products), was approved based on trials adequately reporting and representing all racial and ethnic groups. By subgroup, 16% (9/56) of products were approved based on trials adequately representing black patients, 65% (36/55) Asian patients, and 20% (11/55) Latinx patients. These figures exclude six therapeutics that received a 100% score on their race and ethnicity representation but either did not publicly report enrollment data for at least one racial or ethnic group or were missing national prevalence data on the cancer being studied.
At the trial level, both transparency and representation of racially an ethnically minoritized patients were low: 41% (26/64) of trials transparently reported the number of participants identifying as black, white, Asian, and Latinx (figure 1). By subgroup, the number of participants who were transparently reported to identify as black was 81% (52/64), as Asian was 83% (53/64), as Latinx was 42% (27/64), as Native Hawaiian and Pacific Islander was 15% (9/60), and as American Indian and Alaska Native was 17% (10/60). Only 10% (6/62) of trials adequately represented patients identifying as black, white, Asian, and Latinx. By subgroup, 65% (39/60) adequately represented people who are Asian, 20% (12/60) Latinx, and 15% (9/61) identifying as black (online supplemental tables 2 and 3). Note, the denominators in these analyses exclude trials for cancers missing national prevalence data by race or ethnicity.
Fair inclusion
The median company overall fair inclusion score was 81% (interquartile range 75-87%) (figure 2, table 4). Eight companies scored in the top quarter (at 87% or above), thereby receiving a gold rating: United Therapeutics (100%), Puma (89%), Sanofi (89%), Takeda (89%), Amgen (88%), Bristol-Myers Squibb (88%), Eli Lilly (87%), and Merck KGaA (87%). Five more companies received a silver rating, scoring at or above the median company score: Otsuka, Pfizer, Johnson & Johnson, Gilead, and Eisai.
Specifically, on fair inclusion of women, the median company score was 100% (interquartile range 98-100%) and 14 companies (56%) scored 100%. For overall fair inclusion of older adults, the median company score was 75% (58-94%) and five companies (20%) scored 100%. For fair inclusion of racially and ethnically minoritized patients, the median company score was 68% (50-85%) and only one company (4%) scored 100% (figure 2, table 4).
Discussion
Principal findings
In this study, we developed a measure to assess fair inclusion in clinical research, which captured both the transparency of participant demographics and representation of women, older adults, and racially and ethnically minoritized patients. We applied the measure to evaluate and rate sponsors of novel cancer therapeutics approved by the FDA between 2012 and 2017 on their inclusivity. Overall, we found that all products were sponsored by industry. Although a few sponsors have done well, most have substantial room for improvement with regards to their inclusion of older adults and racially and ethnically minoritized patients, and to a lesser extent women, in cancer pivotal trials.
In terms of transparency, we found that among 25 companies, all but one did not publicly report at least some demographic data on participants of pivotal trials supporting their product approvals. Although all companies reported participants’ sex, more than 60% did not report age and more than 75% did not report race and ethnicity. These findings are consistent with previous studies finding under-reporting of data about older adults and racially and ethnically minoritized patients in cancer trials.1 2 22 23
In terms of adequate representation of demographic subgroups, 44% of companies did not adequately represent women in at least one pivotal trial supporting their product approvals. About 75% of companies did not adequately represent older adults and 84% did not adequately represent at least one racial or ethnic minority group. This study is the first, to our knowledge, to explicitly evaluate pharmaceutical companies on their representation of demographic subgroups in research, but our findings align with other studies assessing the representation of women,24 25 older adults,26–28 and racially and ethnically minoritized patients1 2 29 30 in oncology research.
Several stakeholders have enacted policies to enhance diversity in clinical research, including the National Institutes of Health, FDA, and Bill & Melinda Gates Foundation, as well as individual pharmaceutical companies and asset managers with environmental, social, and governance funds; yet, inequities persist.31 32 No consensus has emerged on enrollment goals or on how to measure adequate demographic inclusion, and thus, how to assess the success of these policies. We used participation to prevalence ratios, following methods developed by Poon and colleagues and methods used in other studies assessing demographic representation in research, to build our fair inclusion metric.20 This method is more data intensive but more accurate than the primary alternative in the literature, benchmarking representation in research against US population demographics. Another method could have been to assess representation among US trial site participants only, excluding trial site participants outside of the US; however, this analysis is not feasible because current public data sources do not breakdown enrollment demographics by country.
To help improve inclusion in research, some people have suggested that the FDA could delay product approvals or only grant accelerated approvals until adequate representation of the disease population among trial evidence is achieved, which can impair product access. Alternatively, the FDA could publish equity report cards for each pharmaceutical company to introduce greater transparency and accountability as well as track progress on clinical trial diversity goals.33 This alternative strategy is what we set out to do in this paper, that is, to develop and pilot the start of such a company scorecard, with the addition of a rating or ranking to further incentivize and recognize top performance on measures. Institutional review boards and research ethics committees can also use these measures to evaluate the inclusion of under-represented groups in research, adding another layer of oversight.34
Many factors are known to contribute to the under-representation of demographic subgroups in clinical research. Trial protocols can use overly restrictive inclusion and exclusion criteria. Many trials exclude patients with specific comorbidities or concomitant medication use, which can limit the number of older adults who qualify for participation, despite cancer incidence increasing with age.35–38 Demographic inequities in clinical trial enrollment can be exacerbated by distrust in the research enterprise; limited access to healthcare, transportation, and childcare33 39–41; and interpersonal discrimination (eg, researchers and clinicians can be less likely to discuss trial participation with black patients).31 42 43
Limitations
Our study has limitations. First, for some specific cancer types, reliable public data on US patient demographics was not possible to locate, requiring use of demographics from the broader cancer type. For example, for mantle cell lymphoma (ibrutinib by Abbvie), we used demographic data for non-Hodgkin’s lymphoma; mantle cell lymphoma is a type of non-Hodgkin’s lymphoma that disproportionately affects more men than non-Hodgkin’s lymphoma. We could not calculate the participation to prevalence ratio for basal cell carcinoma (vismodegib by Genentech and sonidegib by Novartis) nor for Asian patients with neuroblastoma (dinutuximab by United Therapeutics) because demographic data were unavailable in US Cancer Statistics, nor for older adults with neuroblastoma as the incidence of neuroblastoma among older adults is very low. When the sex, age, race, or ethnicity of trial participants could not be determined from public data (we searched four sources: FDA approval packages, FDA trial Snapshots, clinicaltrials.gov, and publications indexed on clinicaltrials.gov), the transparency score for that variable was zero and the representation score was listed as not available. The fair inclusion score would also be zero, in this case, for any specific variables missing demographic information, despite the possibility that the trial was representative on the measure but that no public data were available.
Furthermore, we gathered data from the 2012 to 2017 US Cancer Statistics data set, which includes cancer registry data from the National Programme of Cancer Registries and the National Cancer Institute’s Surveillance, Epidemiology, and End Results, and the American Cancer Society both of which can include some inaccuracies (eg, underserved, minority populations within the US can have lower screening, diagnosis, and access rates to cancer care).
Some drugs targeted conditions specific to biological sex or age (ie, prostate cancer, ovarian cancer, or pediatric neuroblastoma); we assigned a score of 100, if a trial for these drugs adequately represented that biological variable (ie, men for prostate cancer; women for ovarian cancer). This was the case, for instance, for United Therapeutics, which scored 100% on overall fair inclusion measure. The company adequately represented women and racially and ethnically minoritized patients in pivotal trials supporting its approval of dinutuximab treating neuroblastoma. However, neuroblastoma is a pediatric condition, and we assigned a representation score for older adults of 100%, rather than marking those trials as “not applicable” and not assigning a score on that variable (note the company’s overall score would have been the same using either method). We are open to feedback on better ways to address this limitation, which also applied to enzalutamide (sponsored by Pfizer) and radium-223 dichloride (Bayer) approved for prostate cancer, as well as olaparib, rucaparib, and niraparib (sponsored by AstraZeneca, Clovis Oncology, and GSK, respectively) approved for ovarian cancer.
Importantly, fair inclusion in research is necessary but insufficient to achieve full diversity, equity, and inclusion in clinical research and racial and ethnic classification schemes are social constructs, which can shift over time. We focused on novel oncology therapeutics approved in the US. Our findings might not generalize to other products or countries. We attributed responsibility for fair inclusion in research to the sponsors of products on applications for FDA approval but product sponsors sometimes differ from trial sponsors. Furthermore, the product sample size per sponsor is small and could be highly influenced by a single product. Arguably, the company applying for marketing approval of a product should assume responsibility for providing transparent efficacy data that adequately represent the patient population for whom a drug will be marketed, for all products.
Conclusion
Despite concerted efforts by policy makers and many sponsors, including biopharmaceutical companies, to increase diversity and inclusion in clinical trials, progress has been limited. The sponsors in our sample generally performed well for transparency and representation of women in pivotal trials for products approved in 2012-17, but only a few achieved strong performances concerning older adults and racially and ethnically minoritized patients.
The fair inclusion score we developed and tested on oncology pivotal trials provides a useful, feasible method of assessing critical indices of equity in clinical trials. Future research could apply this measure to other types of trials to ascertain whether diversity and inclusion varies by therapeutic area and whether improvement is visible over time. The measure can also help sponsors to evaluate the success of corporate policies and practices aimed at achieving the vision of a more equitable clinical research enterprise.
Data availability statement
Data are available in a public, open access repository. Extra data can be accessed via the Dryad data repository at http://datadryad.org/.44
Ethics approval
Not applicable.
References
Footnotes
Twitter @TanveeVarma
Contributors JM, TV, JSR, CG, and MM designed the study. TV extracted the data, assisted by HW, and WP. TV and JM analyzed the data. JM, TV, JSR, CG, and MM interpreted the data. All authors have full access to the data and take responsibility for the integrity of the data and accuracy of the data analysis. TV and JM drafted the manuscript. JSR, CG, and MM critically revised the manuscript for important intellectual content. All authors approved the final manuscript. JM is the corresponding author and guarantor. The corresponding author attests that all listed authors meet authors criteria and that no others meeting the criteria have been omitted. Kimberly Sabelko, of the Susan Komen Foundation, is a contributor to the paper and provided helpful feedback on the final draft of the manuscript. Haley Wilenzick and William Pelletiers are contributors to the paper and provided assistance with data collection. Transparency: The lead author (the guarantor) affirms that the manuscript is an honest, accurate, and transparent account of the study being reported; that no important aspects of the study have been omitted; and that any discrepancies from the study as planned have been explained.
Funding This study was supported by a grant from the Susan G Komen Foundation. The funder had no role in considering the study design or in the collection or analysis of data or decision to submit the article for publication.
Competing interests All authors have completed the ICMJE uniform disclosure form at www.icmje.org/disclosure-of-interest/ and declare: support from Susan G Komen for the submitted work. MM reports serving as an expert witness on behalf of a generic pharmaceutical company in antitrust litigation against other pharmaceutical companies; as an expert witness for a health insurer in litigation against pharmaceutical companies relating to off-label promotion; and as an advisor to Verily Life Sciences LLC on a product designed to facilitate safe return to work and school during the covid-19 pandemic. JSR receives research support through Yale University from Johnson and Johnson to develop methods of clinical trial data sharing, from the Medical Device Innovation Consortium as part of the National Evaluation System for Health Technology (NEST), from the Food and Drug Administration for the Yale-Mayo Clinic Center for Excellence in Regulatory Science and Innovation (CERSI) program (U01FD005938), from the Agency for Healthcare Research and Quality (R01HS022882), from the National Heart, Lung and Blood Institute of the National Institutes of Health (R01HS025164, R01HL144644), and from the Laura and John Arnold Foundation to establish the Good Pharma Scorecard at Bioethics International; JSR is also an expert witness at the request of Relator's attorneys, the Greene Law Firm, in a qui tam suit alleging violations of the False Claims Act and Anti-Kickback Statute against Biogen Inc. JM receives research support from the Food and Drug Administration for the Yale-Mayo Clinic Center for Excellence in Regulatory Science and Innovation (CERSI) program, the National Institutes of Health, the Laura and John Arnold Foundation, and Susan G Komen Foundation. Additionally, she served as a bioethics advisor for Alexion on expanded access and compassionate use, and Cambia Health’s pharmacy and therapeutics committee. CG reported receiving grants from Johnson & Johnson, the National Comprehensive Cancer Network (funding from AstraZeneca), and Genentech. All other authors declare no competing interests.
Provenance and peer review Not commissioned; externally peer reviewed.
Supplemental material This content has been supplied by the author(s). It has not been vetted by BMJ Publishing Group Limited (BMJ) and may not have been peer-reviewed. Any opinions or recommendations discussed are solely those of the author(s) and are not endorsed by BMJ. BMJ disclaims all liability and responsibility arising from any reliance placed on the content. Where the content includes any translated material, BMJ does not warrant the accuracy and reliability of the translations (including but not limited to local regulations, clinical guidelines, terminology, drug names and drug dosages), and is not responsible for any error and/or omissions arising from translation and adaptation or otherwise.