Article Text

Abstract
Background: Epidemiological research has shown that mortality increases during hot weather and heat waves, but little is known about the effect on non-fatal outcomes in the UK.
Aims and Methods: The effects of hot weather and heat waves on emergency hospital admissions were investigated in Greater London, UK, for a range of causes and age groups. Time series analyses were conducted of daily emergency hospital admissions, 1 April 1994 to 31 March 2000, using autoregressive Poisson models with adjustment for long term trend, season, day of week, public holidays, the Christmas period, influenza, relative humidity, air pollution (ozone, PM10), and overdispersion. The effects of heat were modelled using the average of the daily mean temperature over the index and previous two days.
Results: There was no clear evidence of a relation between total emergency hospital admissions and high ambient temperatures, although there was evidence for heat related increases in emergency admissions for respiratory and renal disease, in children under 5, and for respiratory disease in the 75+ age group. During the heat wave of 29 July to 3 August 1995, hospital admissions showed a small non-significant increase: 2.6% (95% CI −2.2 to 7.6), while daily mortality rose by 10.8% (95% CI 2.8 to 19.3) after adjusting for time varying confounders.
Conclusions: The impact of hot weather on mortality is not paralleled by similar magnitude increases in hospital admissions in the UK, which supports the hypothesis that many heat related deaths occur in people before they come to medical attention. This has evident implications for public health, and merits further enquiry.
- heat waves
- temperature
- hospital admissions
- mortality
- elderly
Statistics from Altmetric.com
Reports that the 2003 heat wave in western Europe led to substantial numbers of deaths in France,1 Portugal2 and elsewhere have focused attention again on the health impacts of hot weather. Under all realistic scenarios of future climate change, the frequency of heat waves in the UK is projected to increase significantly over coming decades,3 raising the question of how best to meet the public health threats that more frequent and prolonged periods of hot weather will present. Epidemiological evidence suggests that we can expect substantial increases in mortality during such episodes, particularly from cardiovascular and respiratory disease, and that the elderly will be especially vulnerable to them.4–8
A more specific question is how well the health service will be able to respond during heat waves. To date there have been comparatively few studies that have quantified heat associated changes in hospital admissions. Increases in emergency admissions and ambulance call-outs during individual heat wave events have been reported from the United States9,10 and the United Kingdom.11 Emergency admissions for heart disease in 12 US cities increased in response to hot weather.12 In this paper, we provide new evidence on the patterns of heat related hospital admissions in Greater London during the 1990s and, in particular, on the impact of the heat wave of 29 July to 3 August 1995.
METHODS
Data on emergency hospital admissions among residents of Greater London, 1 April 1994 to 31 March 2000, were obtained from the Department of Health (Hospital Episode Statistics). Daily counts were stratified into eight age groups and six diagnostic groups (table 1). Diagnostic groups were assigned using only the first cause-of-admission field for each record. The choice of diagnostic groups was made on the basis of plausible physiological mechanisms, and published literature on heat wave impacts:7,13,14 cardiovascular disease (ICD10 I00–I99), respiratory disease (ICD10 J00–J99), cerebrovascular disease (ICD10 I60–I69), renal disease (ICD10 N00–N39), acute renal failure (ICD10 N17–N19), and calculus of the kidney and ureter (ICD10 N20–N23).
Summary statistics for hospital admissions
Daily meteorological data (minimum and maximum temperature, relative humidity) were provided by the Met Office using data for the Heathrow meteorological station (table 2). A daily mean temperature value was created by averaging the daily maximum and minimum values. Daily mean concentrations of airborne particulates (PM10) and ozone (maximum of 8 hour moving average) were obtained for the Bexley monitoring station in southeast London from the archives of the National Air Quality Monitoring Network maintained by the National Environmental Technology Centre, Culham. A weekly indicator for influenza A activity was generated from laboratory reports to the Public Health Laboratory Service Communicable Disease Surveillance Centre.
Summary of daily meteorological and pollution statistics
The relation between admissions and daily mean temperature was investigated using Poisson generalised linear models (GLM) adjusted for autocorrelation. Natural cubic splines of date were used to control for secular trends and any additional confounding by seasonally varying factors other than temperature. We used seven degrees of freedom (df) per year (roughly equivalent to a two month moving average) to allow adequate control for unmeasured confounders (for example, seasonal changes in admission thresholds, health related behaviour, diet) while leaving sufficient information from which to estimate temperature effects. To test whether the choice of number of degrees of freedom was critical to the results, we carried out sensitivity analyses using greater seasonal control (12 df per year), and also using no seasonal adjustment. All models included an indicator for year (to control for small year to year changes in geographical boundaries), daily measures of same day humidity, PM10 and ozone, weekly counts of influenza A, as well as indicators for day of week and public holiday effects. To control for the large changes in admissions around Christmas due to operational and social factors, we used a quadratic term of date for the period 22 December to 4 January.
Main messages
-
Epidemiological research has shown that mortality increases during hot weather.
-
This paper provides new evidence about the effect of heat on hospital admissions in the UK.
-
During the mid to late 1990s, emergency hospitals admissions in London did not rise significantly during periods of high temperature, a finding which is in marked contrast to the observed sensitivity of mortality to heat in the same period.
-
This difference is not readily explained by changes in admission thresholds, or other seasonal factors, and it suggests that many heat related deaths occur in people before they come to medical attention.
-
We conclude that public health efforts to reduce heat related mortality should be directed at protecting vulnerable people who may undergo a rapid decline in response to high temperatures.
We constructed graphs of admissions as smoothed functions of temperature using natural cubic splines with one degree of freedom for every five degrees Celsius of the temperature range. These were based on models with temperature fitted as the average of daily mean temperature over the index and previous two days. (Published research and our own analyses indicate that heat effects occur at very short time lags.)
For quantification of high temperatures effects, we used “hockey stick” (linear spline) models that assume a log linear increase in risk above a heat threshold (th °C). Specifically, we assumed hospital admissions to be log linear functions of degrees above th. Threshold temperatures were identified by comparison of maximum likelihoods estimates over all integer values for thresholds in the range of the data. The thresholds for each series were thus selected on the basis of best model fit (lowest deviance). Any effect of cold temperature was adjusted for using a linear function of temperature (average lags 0–13) below a threshold value, again chosen by maximum likelihood. Confidence intervals for the threshold values were calculated from likelihood values, after adjustment for over-dispersion. Confidence intervals for the slopes are those which apply given the estimated thresholds of heat effects. The same threshold is used within disease groups for comparison of effects between the various age groups.
Policy implications
-
Advice and protection measures during heat waves should be targeted to the very young and the elderly, and those suffering from respiratory and renal disease.
-
During a heat wave, more attention should be paid to the care of the elderly, especially those with pre-existing respiratory disease, for the first signs of heat distress.
-
The use of weather forecasts in summer to improve efficiency in hospital emergency departments should be carefully evaluated.
A six day heat wave occurred from 29 July to 3 August 1995 when maximum daily temperatures in London exceeded 30°C. Excess admissions during this period were defined as the difference between the observed number of admissions and the number expected from the fitted values of the regression model. The relevant models included all covariates described above except for the terms for temperature at lags of 0 to 2 days. We did however include a smoothed function of average temperature over the index and preceding 13 days to capture cold effects. To test the sensitivity of the results to the inclusion of this term, we also repeated analyses without any temperature terms. The results of these analyses provide an estimate of the number of emergency admissions attributable to the heat wave over and above the seasonal and daily “norm” predicted from the baseline. For comparison, the same methods were used to estimate an excess in all cause mortality in Greater London over the same period.
RESULTS
Figure 1 shows the annual distribution of daily emergency admissions for cardiovascular and respiratory disease in London. Each day is averaged across the six years of data to show the seasonal pattern in an average year. For comparison, seasonal patterns in mortality are shown for the same disease groups (averaged across three years, 1994–96). Mortality and respiratory admissions show a strong seasonal pattern, but a lack of seasonality is apparent in daily hospital admissions for cardiovascular disease. Figure 1 also illustrates the effect of public holidays in hospital admission patterns (deficits are apparent at the August Bank Holiday and at Christmas). A winter excess is apparent for admissions due to respiratory disease and confirms the significant impact of seasonal respiratory infections, such as influenza.15,16
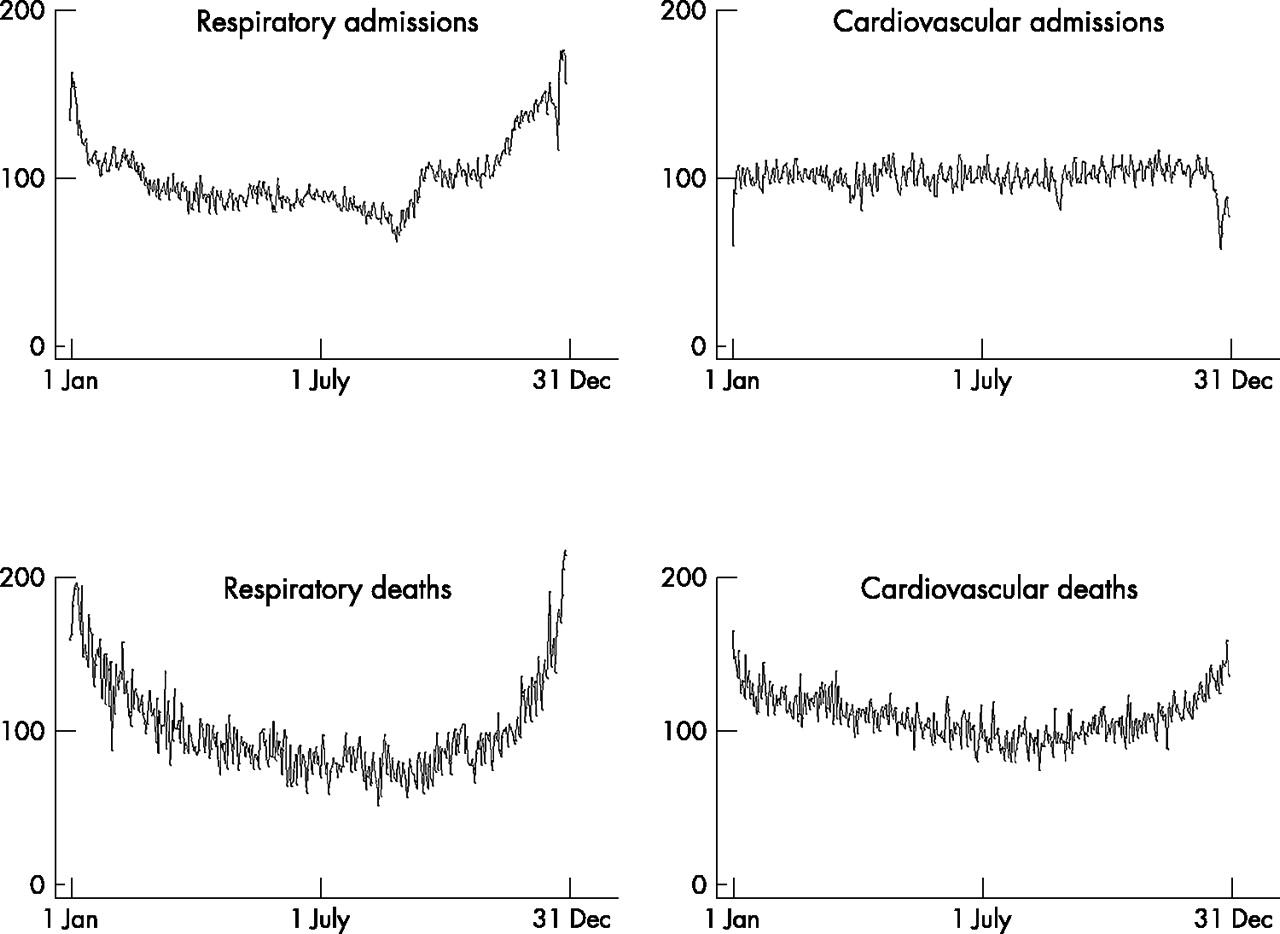
Seasonality of admissions and mortality for respiratory and cardiovascular disease (% of average).
Figure 2 describes the fitted relation between hospital admissions (by cause, and selected age groups) and temperature (average of mean temperature 0–2 days preceding admission). The curves show, for values across the temperature range, the relative risk for the number of admissions. The centre line is the estimated spline curve, and the upper and lower lines represent the 95% upper and lower confidence limits, respectively. For total admissions (all causes), the relation is approximately flat across the entire temperature range (hot and cold weather). No obvious threshold temperature is apparent. Admissions for stroke appear to increase in cold weather but not so during higher temperatures. Admissions for respiratory and renal disease show an increase in response to higher temperatures. The relation is mostly flat for heat effects in the elderly and adults. However, admissions for children under 5 years old increase slightly during hot weather.

Relations between daily temperature and hospital admissions by cause of admission. (Full model adjusted for season, flu, day of week, trend, ozone, PM10, holidays. and Christmas period.) Temperature (°C) on the x-axis (0–2 average), and relative risk on the y-axis.
Table 3 shows the estimated increase in admissions (%) for each degree above the identified threshold value. Due to the flat nature of the relations, it was difficult to determine a precise threshold for many series. Statistically significant (at the 5% level) “heat” effects are apparent for respiratory admissions. In those aged over 75, respiratory admissions increased by 10.86% (95% CI 4.44 to 17.67) for each degree increase in daily mean temperature above 23°C. High temperatures have a significant effect on admissions for renal disease. A small positive association was found between moderately high temperatures and admissions in infants and children under 5 years (admissions increased by 0.24% (95% CI 0.02 to 0.46) for each degree increase in daily mean temperature above 12°C).
Thresholds and slopes for relation between high temperature and hospital admission, by selected causes and age groups
Increasing the degree of seasonal control (from 7 df per year to 12 df per year) for the main cause groups did not change the effect estimates to any great extent (results not shown). When the models are run with no adjustment for season, the estimates in general increased slightly, but the results that were previously non-significant remained so.
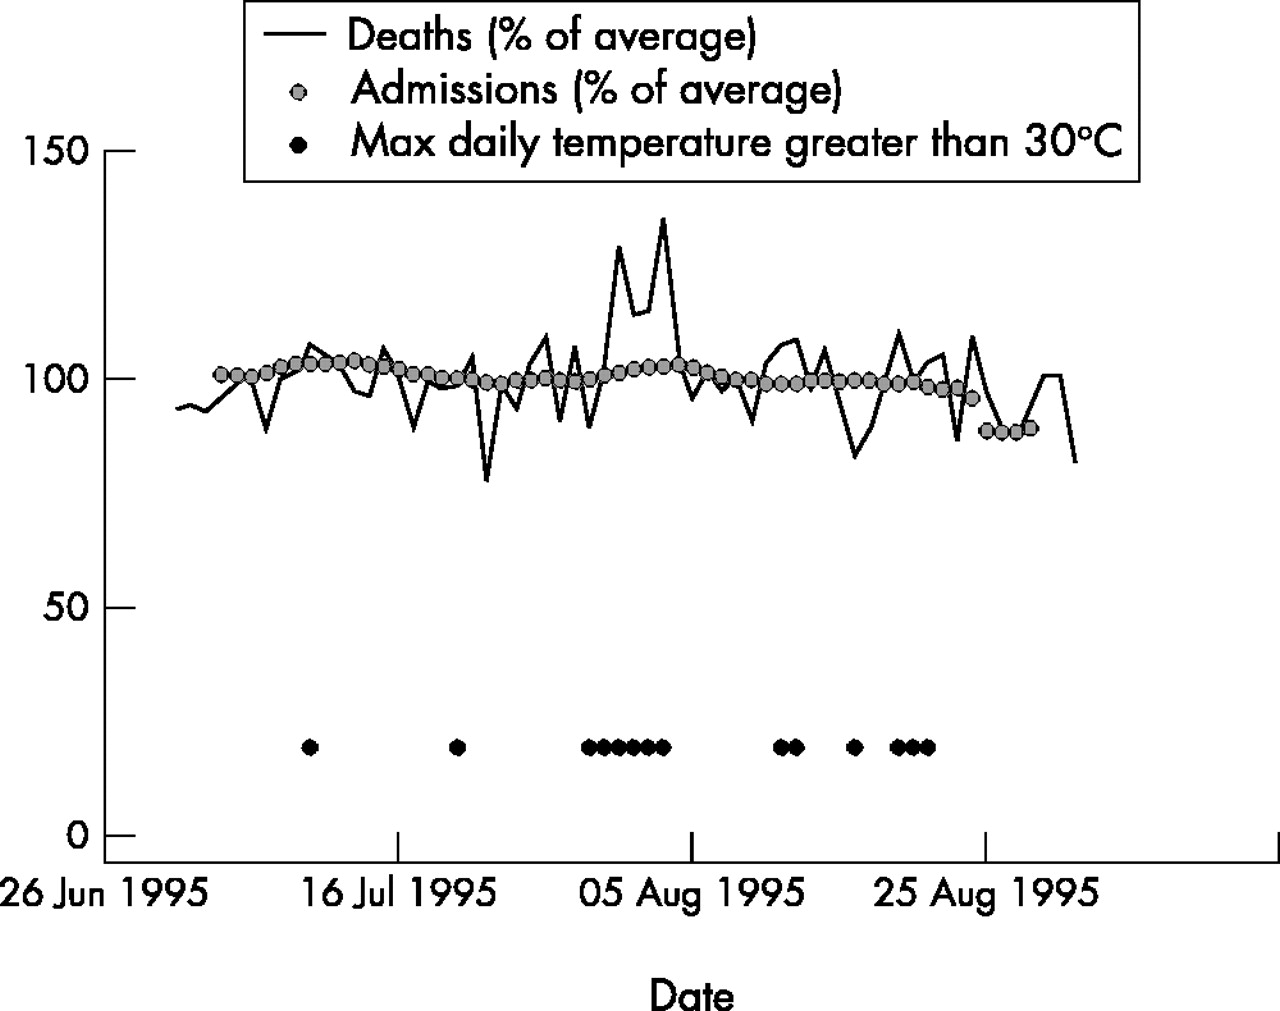
The 1995 heat wave was associated with a short term peak in mortality.7 We estimate that mortality increased by 10.8% during the episode (table 4). Figure 3 illustrates that no such obvious excess is apparent in the emergency hospital admissions series, which has been smoothed to remove the large weekly variability. If the expected values are estimated using the regression model without temperature terms, the estimated excess mortality increased to 11.8% and the excess in hospital admissions (1.9%) remained non-statistically significant.
Excess deaths and hospital admissions during the six day heat wave of 29 July to 3 August 1995 in Greater London

Daily hospital admissions (7 day moving average) and daily deaths (all causes) in Greater London (25 June 1995 to 1 September 1995). Days with maximum temperature above 30°C are indicated.
DISCUSSION
This study provides evidence that hot weather, and heat waves more specifically, have at most only a small effect on the number of emergency hospital admissions in London, a finding which contrasts with previously reported results for mortality. For example, a 3.3% increase in all-cause deaths has been observed in London for every 1°C increase in temperature above 21.5°C.6 In our study, analyses based on all days of the year, or on all days during the summer period (April to September—results not shown), showed no increase in all-cause emergency admissions during hot weather, and the estimate for the 1995 heat wave episode was of a small percentage increase in admissions (though the confidence interval was imprecise). The apparent variations in heat impact by age and diagnostic group require cautious interpretation because of the number of subgroups examined, but heat related increases in emergency admissions for diseases of the renal system, and in young children, are compatible with current understanding of pathophysiological mechanisms and vulnerable groups. Acute renal failure has been described in previous heat waves associated with exertional heat stroke, and in patients with chronic medical conditions such as cardiovascular disease and diabetes;13,14 and there have been reports of increases in hospital attendance for trauma in young children on dry and sunny days.17,18 Increases in admissions from respiratory disease have also been observed in previous studies.19
What is more surprising is the small or absent impact of heat on cardiovascular admissions and on admissions in the elderly, a group consistently shown to be sensitive to heat related mortality, and the apparent negative association of heat with admissions for cerebrovascular disease.
But the contrast between hospital admissions and mortality is perhaps the most remarkable finding, and one which is not readily explained by an artefact of the data or analysis. As with many routine data sets, there are some uncertainties over the completeness and accuracy of Hospital Episode Statistics, but data errors are unlikely to have an appreciable effect on the estimates of heat impacts. Firstly, when data are pooled over the whole of London, errors from individual hospitals tend to be averaged out. Secondly, the principle of time-series analyses of heat effects is to concentrate on short term (day to day) changes, and there is little reason why a short term increase in admissions relating to heat would be masked by data errors. For more gradual changes, we include smoothed functions of date as well as an indicator of year to allow for a varying baseline. Finally, the data do show the expected patterns of change in relation to day of week, public holidays, and particulate air pollution, which suggests data quality is not the likely explanation for the small or absent heat effect.
Another possible explanation relates to blunting of the expected rise in admissions because of lack of available beds for emergency patients. However, heat waves occur during the period of the year when pressures on hospital beds are generally at their lowest, and again, our inclusion of seasonal control should provide at least some adjustment for such shifting thresholds. Such control might not provide adequate adjustment for very short term changes in admission thresholds arising from a sudden rise in admissions on one or two days, but our models did include autoregressive terms which provide some adjustment for this.
Sensitivity analyses showed that the estimates of effect were not appreciably influenced by the degree of seasonal adjustment, the parameterisation of humidity, or the inclusion of autoregressive terms. We also analysed the warm season months separately (April to September inclusive), and this too had very little effect on the estimates (results not shown).
Our conclusion is that emergency hospital admissions are comparatively little affected by heat, which accords with the limited published literature. During the infamous seven day Chicago heat wave of 1995, all cause mortality increased by 147%,20 while emergency hospital admissions increased by a comparatively modest 11% (all ages),10 more than half of which were for classical heat illnesses. Hospital admissions in Birmingham, UK, during the 1976 heat wave were reported to have increased over the 14 day event, and only nine admissions were for acute heat illness.11
A possible explanation for the mismatch in patterns of mortality and hospital admissions during hot weather may be that many deaths occur rapidly or in isolated people before they come to anyone’s attention. Many of the deaths in the Chicago heat waves were of people living alone or who had limited social contact.21,22 This observation may have important implications for public health, as it suggests the need during periods of high temperature is not so much to increase the capacity of secondary health services, as to strengthen the protection and support of people in the community.
Climate models suggest that the frequency of heat waves is almost certain to increase under global warming.3 Although much publicity has focused on the number of additional deaths in France during the 2003 heat wave, the burden of deaths in the UK, where temperatures were less extreme, was probably also substantial. If the temperature-mortality relation during the 2003 heat wave was similar to that seen in past heat waves (3.3% increase per degree C mean temperature over 21.5°C6) we estimate that 1400 additional deaths might have occurred over the eight day period between 6 and 13 August 2003 in England and Wales. This is broadly in line with a preliminary analysis by the UK Office for National Statistics which reports 2045 excess deaths from 4 to 13 August when compared with average deaths for the same days in previous years (1998–2002).23
If we are to prevent such deaths in the future, public health efforts need to be directed towards improving contact with isolated vulnerable people in their own homes, and providing better information on the early symptoms of heat stress. Heat waves can be predicted several days in advance, giving sufficient time to allow preventive steps to be taken as part of a hot weather warning system.24,25 How effective our protective efforts can be has yet to be seriously tested.
Acknowledgments
Shakoor Hajat and Sari Kovats were funded by the European Commission as part of the project: Climate Change and Adaptation Strategies for Human Health (cCASHh) (EVK2-2000-00070). Paul Wilkinson is supported by a Public Health Career Scientist Award (NHS Executive, CCB/BS/PHCS031).
REFERENCES
Linked Articles
- Work in brief