Article Text

Abstract
Objective To estimate the associations between long term exposure to air pollution and the first hospital admission related to kidney and total urinary system diseases.
Design Nationwide longitudinal cohort study.
Setting Data were collected from the Medicare fee-for-service for beneficiaries living in 34 849 zip codes across the continental United States from 2000 to 2016. Exposure variables were annual averages of traffic related pollutants (fine particles (PM2.5) and nitrogen dioxide (NO2)) that were assigned according to the zip code of residence of each beneficiary with the use of validated and published hybrid ensemble prediction models.
Participants All beneficiaries aged 65 years or older who were enrolled in Medicare part A fee-for-service (n=61 097 767).
Primary and secondary outcome measures First hospital admission with diagnosis codes for total kidney and urinary system disease or chronic kidney disease (CKD), analyzed separately.
Results The average annual concentrations of air pollution were 9.8 µg/m3 for PM2.5 and 18.9 ppb for NO2. The total number of first admissions related to total kidney and urinary system disease and CKD were around 19.0 million and 5.9 million, respectively (2000-16). For total kidney and urinary system disease, hazard ratios were 1.076 (95% confidence interval 1.071 to 1.081) for a 5 µg/m3 increase in PM2.5 and 1.040 (1.036 to 1.043) for a 10 ppb increase in NO2. For CKD, hazard ratios were 1.106 (1.097 to 1.115) for a 5 µg/m3 increase in PM2.5 and 1.013 (1.008 to 1.019) for a 10 ppb increase in NO2. These positive associations between PM2.5 and kidney outcomes persisted at concentrations below national health based air quality standards.
Conclusions The findings suggest that higher annual air pollution levels were associated with increased risk of first hospital admission related to diseases of the kidney and urinary system or CKD in the Medicare population.
- Kidney failure, chronic
- Public health
- Nephrology
This is an open access article distributed in accordance with the Creative Commons Attribution Non Commercial (CC BY-NC 4.0) license, which permits others to distribute, remix, adapt, build upon this work non-commercially, and license their derivative works on different terms, provided the original work is properly cited, appropriate credit is given, any changes made indicated, and the use is non-commercial. See: http://creativecommons.org/licenses/by-nc/4.0/.
Statistics from Altmetric.com
What is already known on this topic
A few studies have reported that long term exposure to air pollution is associated with an increased risk of incident chronic kidney disease (CKD)
The generalizability of these results is limited because of the non-representative nature of the study populations
What this study adds
The findings of this large nationwide study suggest that long term exposures to fine particles (PM2.5) and nitrogen dioxide (NO2) were associated with an increased risk of first hospital admission related to diseases of the kidney and urinary system or CKD
These associations were found to persist at levels below the current annual National Ambient Air Quality Standards for PM2.5 and NO2
How this study might affect research, practice, or policy
The findings of this study suggest an adverse effect of air pollution on diseases of the kidney and urinary system, which could help establish public health interventions
Introduction
Kidney disease has been recognized as a worldwide public health concern owing to the increased risk of early death, cardiovascular disease, and poor quality of life.1–3 Globally, over 750 million people have kidney diseases,4 5 annual mortality attributable to kidney disease might be as high as 5 million,6 and its prevalence has increased during recent decades.7 8 Among the types of kidney disease, chronic kidney disease (CKD) is an important public health priority worldwide.4 7 9 In 2016, CKD was the 13th highest cause of death on a global scale and projections suggest that it will become the world’s fifth leading cause of death by 2040.10 In the United States, about 15% of adults (37 million) were estimated to have CKD in 2021 and the disease is more common in people aged 65 years or older (38.1%).11 Kidney disease results in high medical costs and financial burden for Medicare. According to the 2020 US Renal Data System annual data report, the total Medicare fee-for-service (FFS) spending for beneficiaries with CKD who did not have end stage renal disease exceeded $81bn in 2018 (£61.7bn, €72.7bn; 22.3% of Medicare FFS spending), and annual expenditure for beneficiaries aged 66 years or older was estimated at $23 691 per person.12 The total Medicare FFS expenditures for beneficiaries with end stage renal disease was $36.6bn in 2018 (7.2% of Medicare spending).
Recently, air pollution has been suggested as a potential risk factor for low glomerular filtration rate and kidney disease.13–16 Inhaled air pollution can cause oxidative stress and DNA damage to kidney tissue,17 and cardiovascular and endocrine toxicities related to air pollution, such as disturbances in the autonomic nervous and circulatory systems and pulmonary inflammatory disease, have also been suggested as biological mechanisms linking air pollution exposure and kidney disease.14 18 19 In spite of these plausible biological mechanisms, associations between air pollution and kidney disease have been studied less than those for cardiovascular and respiratory diseases.13 Several recent cohort studies investigated the association between air pollution exposure and the incidence of kidney disease.13 14 20–22 Although these studies consistently reported the positive association between exposure to air pollution and the risk of kidney disease, these studies had limitations related to the type of participants (eg, US veterans who were mostly white men),13 14 locations,22 and sample size (less than 200 000)20 21; therefore, the results were limited in providing generalizable estimates for the association between air pollution and kidney disease. Additionally, air pollution concentrations in the US have been reduced in the past few decades; therefore, it is crucial to evaluate whether the relation between air pollution and kidney disease persists at lower concentrations.23
To resolve these gaps in knowledge, we performed a nationwide longitudinal cohort study of Medicare Part A FFS beneficiaries from 2000 to 2016, a population of over 61 million, with 410 million person years of follow-up (that is, an average 6.7 follow-up years per person). We investigated the association between long term exposure to air pollution and the first hospital admission related to total kidney and urinary system disease or CKD. A nationwide air pollution dataset integrating validated zip code level fine particulate matter (PM2.5) and nitrogen dioxide (NO2) prediction models was used. These pollutants are key components of pollution from traffic, although they have other sources such as energy production and industry. Based on the large sample size and geographical scope, the study aimed to provide generalizable and statistically reliable results on the association between traffic related air pollution and the first hospital admission related to total kidney and urinary system disease or CKD with state-of-the-science air pollution prediction models.
Methods
The findings are reported in accordance with the strengthening the reporting of observational studies in epidemiology (STROBE) guidelines (see online supplemental material A).
Supplemental material
Study design and participants
Our longitudinal study cohort consisted of beneficiaries who were enrolled in Medicare part A FFS (age 65 years or older) in the US from 1 January 2000 to 31 December 2016. We used the Medicare inpatient hospital claims from the Medicare Provider and Analysis Review files that contain one record per hospital admission. People become eligible to enter Medicare at age 65 years. Follow-up for each beneficiary started on 1 January 2000 or 1 January of the year after entry into the cohort and continued until the first admission with diagnosis codes related to each kidney outcome (total kidney and urinary system disease or CKD, analyzed separately), death, or end of the study period (31 December 2016), whichever came first. For each beneficiary, we extracted the date of the first admission, age, sex, self-reported race, zip code of residence, and Medicaid eligibility (as a proxy for low socioeconomic status24 in each follow-up year). Additionally, if the residential address changed during the follow-up period, exposure assessment incorporated any address changes in the analysis. For each zip code, the mean population was around 7500 and the median land area is about 92 km2.
We used international classification of diseases (ICD) codes to identify diseases of the kidney and the urinary system (ICD-9: 580-599; ICD-10: N00-N39) and CKD (ICD-9: 585; ICD-10: N18) as the primary or secondary diagnosis during the study period. Analysis is based on each participant’s first hospital admission related to a given cause. The kidney and bladder are linked by ureters and are closely related. For example, neurogenic bladder and bacterial infections in the bladder and urinary tract are major causes of kidney diseases.25 26 Additionally, kidney stones are an important risk factor for urinary diseases, such as hematuria and urinary tract infections.27 This study did not subdivide kidney and urinary disease, and previous studies also applied the combined ICD codes for total kidney and urinary system disease (N00-N39) as total renal disease.28–34 Because kidney disease has causal associations with hypertension, diabetes, and cardiac diseases, and is also closely associated with various complications including heart disease, stroke, and other metabolic diseases,35 we considered the primary and secondary diagnosis ICD codes in the main analysis. Therefore, the outcomes of this study should be interpreted as the first hospital admission related to total kidney and urinary system disease or CKD.
Air pollution data
We obtained daily concentration predictions of ambient levels of PM2.5 and NO2 at 1×1 km2 spatial resolution across the contiguous US from validated, published models.36 37 We used these data to calculate the daily mean concentration of each air pollutant for each zip code by averaging the predictions at the grid cells with centroid points inside the boundary of that zip code.23 24 38 For each calendar year, we assigned the annual average concentrations for each zip code to Medicare enrollees according to the zip code of residence and calendar year to calculate long term exposures to air pollutants.23 24 38 The coefficients of determination (cross validated R2) for annual PM2.5 and NO2 were 0.89 and 0.84, respectively, across the study area.36–38 Detailed information on the air pollution data is given in online supplemental material B.
Statistical analysis
We applied a two pollutant Cox equivalent reparameterized Poisson approach to manage the computational challenges of the conventional Cox proportional hazard model (eg, insufficient memory size and lengthy computation time).23 This Poisson model was mathematically identical to a time varying Cox proportional hazard model under an Anderson-Gill representation.23 39 Specifically, for each of two kidney outcomes (first hospital admission related to total kidney and urinary system disease or CKD), a stratified Poisson model with a log link function was fit to estimate the association between time varying annual air pollutant and the first hospital admissions related to total kidney and urinary system disease or CKD. The dependent variable was the number of first hospital admissions in each follow-up year, calendar year, and zip code within stratums specified by individual variables: age at study entry in two year categories (65-66, 67-68, …, ≥85), sex, race (white, black, and other—Asian, Hispanic, American Indian, Alaskan Native, and unknown), and Medicaid eligibility. Data on race were obtained from Medicare beneficiary files and further divisions of race were not possible owing to the structure of the data. The corresponding total person time of beneficiaries within each stratum was used as the offset. Confidence intervals were calculated using m out of n bootstrap.40 This study did not consider missing data imputation because the data were complete for the considered variables (eg, age, residential zip code, ICD code). To measure the associations between air pollution and kidney outcomes, we estimated a hazard ratio for each 5 µg/m3 increase in PM2.5 and 10 ppb increase in NO2.
For potential confounding, we also adjusted for neighborhood level socioeconomic status indicators.23 24 These indicators were available at zip code or county level and included population density, proportion of the population below the federally defined poverty level, median household income, racial composition, education level, smoking rate, average body mass index, and average air temperature. Additionally, to adjust potential residual confounding by spatial and temporal trends, we included indicator variables for region (Northeast, Southeast, Midwest, Southwest, and West) and calendar years. Detailed information about the indicators is given in online supplemental material C. Finally, to investigate the potential non-linear association between air pollutants and kidney outcomes, we replaced the linear term of air pollution in the main model with a B spine function with three equally distributed internal knots (at the 25th, 50th, and 75th percentiles of the air pollution concentrations) for each pollutant.41
Low pollution cohort
To estimate the associations between air pollution and kidney outcomes at low concentrations, we repeated the main analysis but only included a subset of the main cohort with annual exposures lower than 12 µg/m3 and 20 ppb for PM2.5 and NO2, respectively, over the study period. The current health based National Ambient Air Quality Standards (NAAQs) are 12 µg/m3 for PM2.5 and 53 ppb for NO2.
Subgroup analysis
To identify subpopulations with higher vulnerability, we evaluated potential effect modification by race, age group (65-74 and ≥75 years), sex, and Medicaid eligibility (as a proxy for low socioeconomic status) by including additional interaction terms between these variables and air pollutants in the main analysis. We also conducted region stratified analyses to assess potential heterogeneities among regions, which could relate to differences in chemical compositions, environmental and climatic conditions, and populations.
Sensitivity analysis
We performed sensitivity analyses to examine whether our main results are robust to the selection of confounders, inclusion of participants with prevalent disease, exposure time window, and potential outcome misclassification. To exclude those with potentially prevalent disease, we repeated the analyses using data excluding beneficiaries who had their first hospital admission for the outcomes in the first two years of follow-up. We also applied one year lag period exposures as an alternative exposure window. Finally, we performed a sensitivity analysis restricting kidney outcomes to those with primary diagnosis codes only.
Patient and public involvement
Patients and the public were not involved in the design, or conduct, or reporting, or dissemination plans of this research. This study did not include plans to recruit participants and only used pre-existing Medicare part A datasets. All data used in this study were prerecorded and deidentified.
Results
The full cohort dataset included 61 097 767 beneficiaries living in 34 849 zip codes. Table 1 presents descriptive information about the beneficiaries. There were 410.3 million person years of follow-up for total kidney and urinary system disease and 454.5 million for CKD (table 2). The median follow-up was five years for total kidney and urinary system disease and six years for CKD. For hospital admissions, 27.6% for total kidney and urinary system disease (5 291 896) and 0.98% for CKD (57 875) were identified as the primary discharge diagnosis code. The total number of first admissions was around 19.0 million for total kidney and urinary system disease and 5.9 million for CKD. Figure 1 shows the geographical distribution of first hospital admissions for total kidney and urinary system disease, and CKD. The low pollution cohort included 113.5 million person years of follow-up for total kidney and urinary system disease and 126.5 million for CKD (table 2).
Descriptive cohort characteristics for US Medicare beneficiaries from 2000 to 2016. Values are number (%) or mean (SD)
Admissions related to total kidney and urinary system disease and chronic kidney disease (CKD), and association between air pollution and first hospital admission related to kidney diseases

Nationwide first hospital admissions for total kidney and urinary system disease (upper panel) and chronic kidney disease (lower panel) per 100 000 Medicare fee-for-service beneficiaries across the contiguous United States from 2000 to 2016
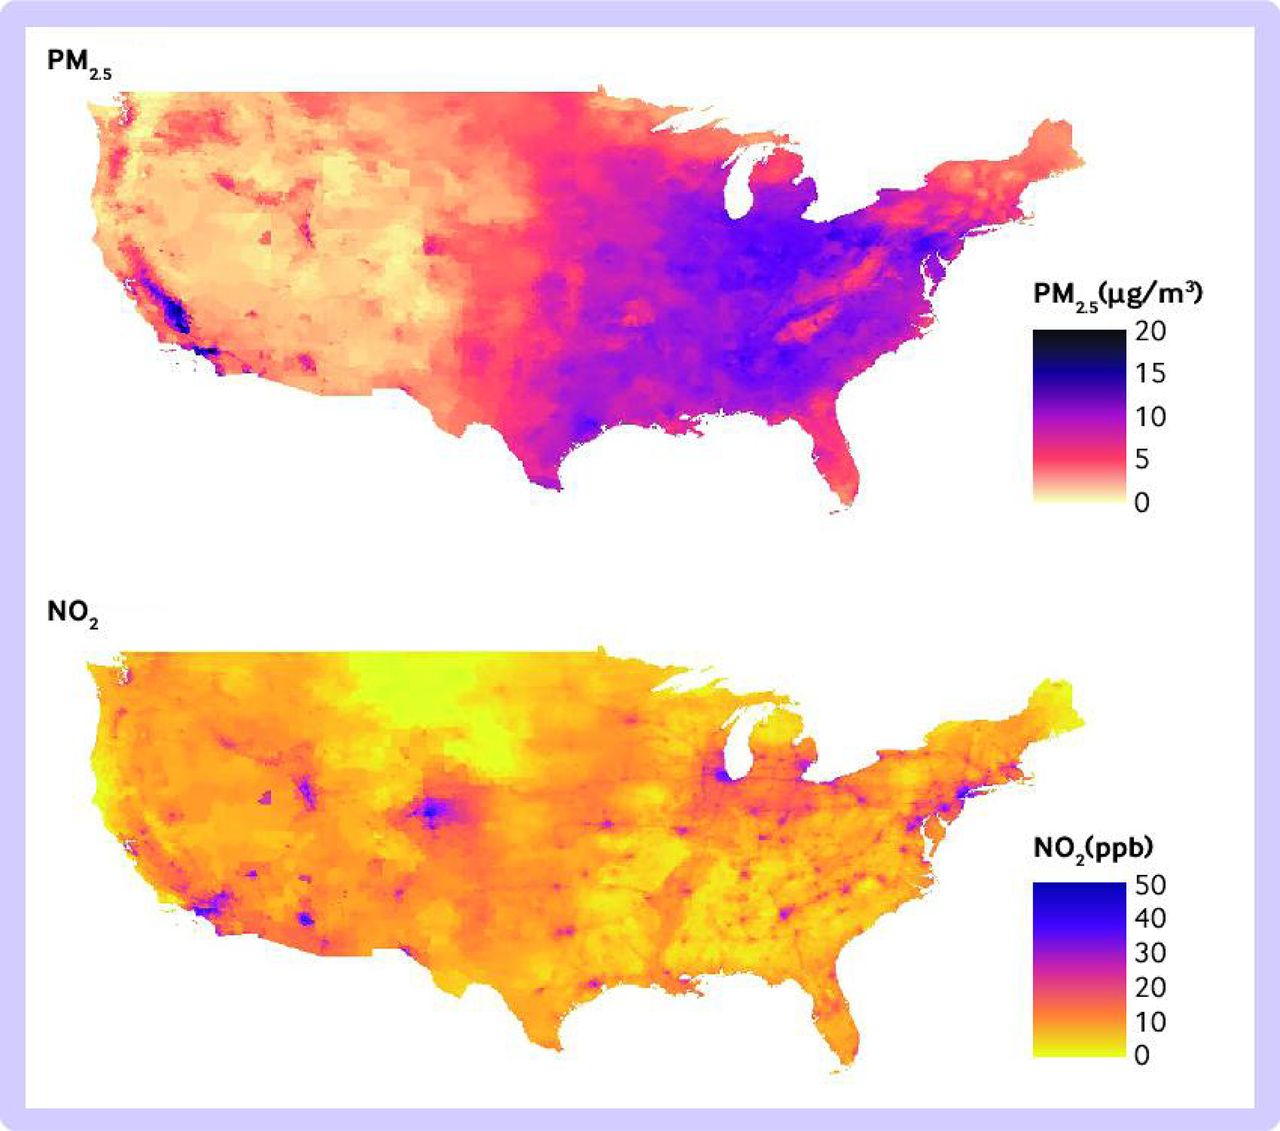
The average annual concentrations of air pollution over the study period were 9.8 µg/m3 for PM2.5 and 18.9 ppb for NO2. The highest PM2.5 concentrations were in California and the eastern and southeastern US. The highest NO2 concentrations were observed in metropolitan areas such as New York, Los Angeles, Denver, and Chicago (figure 2).

Nationwide concentrations of air pollution across the contiguous United States from 2000 to 2016. Seventeen year average of annual fine particulate matter (PM2.5; upper panel) and nitrogen dioxide (NO2; lower panel)
In the full cohort, long term exposures to air pollution were positively associated with total kidney and urinary system disease for both pollutants, with hazard ratios of 1.076 (95% confidence interval 1.071 to 1.081) for a 5 µg/m3 increase in PM2.5 and 1.040 (1.036 to 1.043) for a 10 ppb increase in NO2 (table 2). In the low pollution cohort, the associations remained significant: 1.133 (1.121 to 1.145) for PM2.5 and 1.021 (1.009 to 1.033) for NO2. CKD also showed positive associations with PM2.5 (1.106, 1.097 to 1.115) and NO2 (1.013, 1.008 to 1.019) in the full cohort. In the low pollution cohort, the risk related to PM2.5 was higher in the low pollution cohort than in the full cohort with a hazard ratio of 1.202 (1.165 to 1.240) for the low pollution cohort compared with the full cohort, although there was no evidence of a statistically significant relation with NO2.
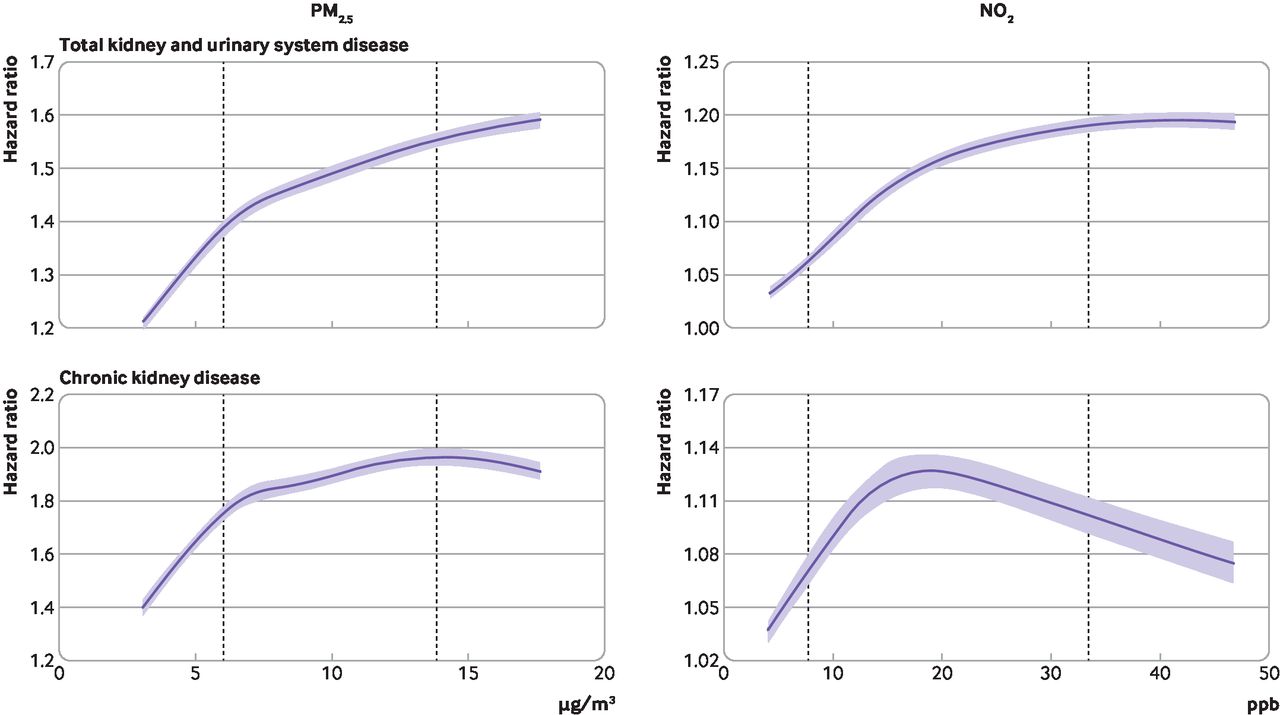
Figure 3 shows the concentration-response associations for each kidney outcome and each pollutant. Table 2 presents results from the linear model. For PM2.5, the non-linear association between pollutant level and hazard ratio showed a consistent rise, with an increased risk at higher levels of PM2.5 for both kidney outcomes in general, and the slopes for both curves were steeper at concentrations lower than 8 µg/m3. NO2 also showed a consistently increased risk with higher exposure for total kidney and urinary system disease, whereas the association with CKD showed a decreasing pattern with larger confidence intervals for NO2 concentrations higher than around 20 ppb (approximately 60th percentile of the NO2 distribution).

Concentration-response curves showing association between long term air pollution exposure and kidney diseases. Total kidney and urinary system disease (upper panels) and chronic kidney disease (lower panels). Dashed vertical lines represent 10th and 90th percentiles of each air pollution concentration and shaded areas indicate 95% confidence intervals. Reference exposure points: 0 µg/m3 for fine particles (PM2.5) and 0 ppb for nitrogen dioxide (NO2)
Table 3 shows the results from subgroup analyses. For both kidney outcomes, white participants had higher associations with PM2.5 compared with the black population, and beneficiaries who were eligible for Medicaid generally had lower estimated associations with both pollutants than those who were not eligible for Medicaid. Women showed lower air pollution related risks on kidney outcomes than men. Additionally, positive associations with air pollution were generally observed in all regions of the US for both kidney outcomes (online supplemental table S1), with the highest PM2.5 and NO2 association estimates observed in the Southwest and Midwest, respectively.
Association between air pollution and first hospital admission for total kidney and urinary system disease or chronic kidney disease for specific subpopulations
The findings from our sensitivity analysis were generally consistent with the main results. Our findings were robust to adjustment for other confounders, removal of people with prevalent disease, and use of a different exposure window (online supplemental table S2). For total kidney and urinary system disease, exclusion of those identified by secondary diagnostic codes did not change the main results, although all estimates slightly increased; however, CKD showed negative associations with all air pollutants when those identified by secondary diagnostic codes were excluded.
Discussion
Principal findings
This large nationwide prospective cohort study of over 61 million Medicare beneficiaries found that long term exposures to PM2.5 and NO2 were associated with an increased risk of first hospital admission related to diseases of the kidney and the urinary system or CKD. These associations persisted even at levels below the current annual NAAQS for PM2.5 and NO2. Furthermore, the study found that white people and those not eligible to receive Medicaid are more vulnerable than the general population. These findings suggest that improving air quality can contribute to public health benefits overall and also provide evidence on the benefit of a more stringent air pollution standard for people who potentially have kidney disease.
Comparision with other studies
The findings of this study are consistent with previous research studying the association between long term exposure to air pollution and kidney diseases. Two recent US Veteran cohort studies (about 2–2.5 million cohort participants who were mostly white men) showed that exposures to higher concentrations of particulate matter no larger than 10 µg/m3 (PM10), PM2.5, carbon monoxide, and NO2 are associated with increased risk of incident CKD and end stage renal disease.13 14 Another cohort study conducted in four US counties (10 997 participants) reported that higher annual average PM2.5 was associated with increased urinary albumin-creatinine ratio and higher risk of incident CKD.22 Cohort studies in China (71 151 participants) and Taiwan (around 100 000-160 000 participants) found that exposure to long term air pollution was associated with an increased risk of CKD, end stage renal disease,20 21 and membranous nephropathy.42 Nevertheless, owing to the limited cohort participants and different study regions, the findings from these previous studies have limited generalizability. This study provides more generalizable estimates for the risks of air pollution relating to total kidney and urinary system disease and CKD for the US Medicare part A FFS population by using a cohort of almost 61 million beneficiaries across the contiguous US with high spatial resolution air pollution data.
Strengths and limitations
We observed a significant association between PM2.5 and the first hospital admission related to diseases of the kidney and the urinary system at low concentrations of air pollution, suggesting that the health benefit per unit decrease in the concentration of PM2.5 might be consistent across concentrations below the current NAAQS. This potential saturation effect (lower air pollution risk at high ranges of annual air pollution) can be explained by smaller risk changes in annual mean air pollution concentration in regions with higher baseline air pollution levels.41 Furthermore, from the non-linear concentration-response curves, we found no evidence of a threshold value (a concentration below which air pollution exposure does not affect kidney outcomes) for harmful pollution.
The large sample from the Medicare part A FFS cohort enabled us to estimate air pollution risks relating to kidney diseases among subpopulations.24 However, the results should be carefully interpreted because of small sample sizes for some subpopulations, such as racial minority groups and people eligible for Medicaid, compared with others. Further research is needed that investigates the association between air pollution and kidney disease in potentially vulnerable subpopulations, including potential differences in diagnosis and access to healthcare, especially given the high number of people with undiagnosed disease. The estimated associations between air pollution and kidney outcomes were generally higher in white participants and those not eligible for Medicaid. This finding conflicts with results from previous US studies reporting higher air pollution mortality risk in non-white populations and those eligible for Medicaid,24 43 although it is consistent with some other study results. A few plausible explanations exist; one possibility is competing risks. A previous study in Taiwan reported that people with comorbidities showed a lower risk related to PM2.5 and CKD development.20 Another study in Korea reported that patients with CKD and healthy lifestyles (normal weight, non-smokers, and non-drinkers) showed a higher air pollution mortality risk than patients with CKD and non-healthy lifestyles.44 These findings suggest the possibility of competing risk between air pollution and biological or behavioral factors that affects the incidence of kidney disease; the results by race and Medicaid eligibility could be affected by the potential competing risks of underlying health conditions and other risk factors. Another possibility is that the longer life expectancy of high income and white populations could affect the results of this study. The life expectancy of those with high income is longer than that of low income populations,45 and white populations also have a longer life expectancy than black populations.46 Because the older population is more vulnerable to the incidence of kidney disease,11 47 the relatively longer life expectancy of Medicaid non-eligible and white populations could be related to the higher air pollution related risks on kidney outcomes in this study. Finally, because low income and racial or ethnic minority populations generally have less access to medical facilities,48 underdiagnosis could potentially affect the results. Subgroup results should be examined in future studies with more detailed clinical and socioeconomic indicators.
This study has several limitations. Firstly, the outcome of first hospital admission with diagnosis codes for kidney diseases has limitations when interpreted as the onset of kidney disease. According to the Centers for Disease Control and Prevention, most adults with CKD do not recognize they have CKD,11 and hospital admission can occur at more advanced stages of the disease or for treating complications attributable to kidney disease. Moreover, kidney disease is generally diagnosed through laboratory tests (eg, the estimated glomerular filtration rate, creatinine, and the accumulation of end products of nitrogen metabolism),35 49–51 and previous studies have reported that the incidence of kidney disease was substantially underestimated when ICD codes were used to define kidney disease.52 53 Therefore, the hospital admission records do not fully represent disease incidence, and our cohort probably undercounted the total kidney disease incidence. Additionally, because the use of ICD codes limits the classification of individual disease and the small sample size of specific disease, we did not investigate specific kidney diseases except for CKD and instead used the total kidney and urinary system diseases based on earlier published studies.28–34 Therefore, we were not able to investigate kidney and urinary disease separately, although an association exists between some kidney and urinary diseases.30–33 Therefore, our study did not investigate the potential heterogeneity of biological mechanisms among specific kidney and urinary diseases related to air pollution.
Secondly, the potential competing events (eg, hypertension, diabetes, and cardiovascular diseases; not death) that might affect the first hospital admission related to kidney disease35 49 54 were not considered in this study because of limited data availability. Thirdly, patients with CKD defined in this study represent a subset of those with total kidney disease; these patients were not independent of the total number of patients with kidney and urinary system disease. Therefore, the apparent air pollution related risks for total kidney and urinary system disease could be due to confounding with CKD,55 and bias could exist in the results of total kidney and urinary system disease resulting from estimating the effects on CKD. Furthermore, additional research is needed on the association between air pollution and CKD in relation to diagnosis, especially given the large number of participants with undetected disease. In this study CKD was identified as the primary diagnosis in less than 1%; most participants with CKD were identified through hospital admission for comorbidities.54 Other areas of interest are the impacts of air pollution on recurrent events. This study investigated first hospital admissions only, but subsequent hospital admissions might also be of interest. Importantly, the association between air pollution and CKD was present when primary and secondary ICD codes were considered, but not when the primary code only was considered, which warrants further investigation.
Fourthly, our results only represent the Medicare part A FFS population that does not include all Medicare beneficiaries (the Medicare FFS population covers up to around 75% of the Medicare population).23 We had no information on Medicare Health Maintenance Organization claims, therefore, we could not cover the entire Medicare population. Fifthly, although we adjusted for several neighborhood level indicators, Medicare claims do not include extensive individual level data on behavioral and socioeconomic risk factors, which could be crucial confounders. Additionally, owing to limitations of the study data, we were not able to consider the potential effect modifications by comorbidities and CKD stages. These unmeasured individual level confounders might help to elucidate the biological mechanisms underlying the observed association between air pollution and kidney disease, and they should be looked at in future studies. Finally, future research could also investigate complex air pollution mixtures. We focused on traffic related air pollutants of NO2 and PM2.5, although each of these pollutants also has non-traffic sources, and actual air pollution mixtures are complexes with other pollutants and different chemical structures of PM2.5. We also used state-of-the-science air pollution prediction data, which are only available until 2016; therefore, future studies should investigate the association between air pollution and kidney disease with more recent data.
Conclusion
We found that long term exposures to higher levels of air pollution were associated with increased risk of a first hospital admission related to total kidney and urinary system disease or CKD, even at low pollution concentrations. Our findings suggest that improvement of air quality might have some benefits in reducing kidney and urinary system disease.
Ethics approval
This study was approved by the Yale institutional review board (protocol No 1608018335).
Acknowledgments
This study was supported by the project titled "Institute of Ewha-SCL for Environmental Health (IESEH) and Research of Environmental Examination Model for Children and Women (No 1-2022-0205-001-1)."
References
Supplementary materials
Supplementary Data
This web only file has been produced by the BMJ Publishing Group from an electronic file supplied by the author(s) and has not been edited for content.
Footnotes
Contributors WL is the guarantor; had full access to all of the data in the study and takes responsibility for the integrity of the data and the accuracy of the data analysis. WL was responsible for the study concept and design, drafting of the manuscript, statistical analysis, and final approval of the article to be published. MBS, DB, and JS were responsible for the acquisition of data, analysis, or interpretation of data. WL, XW, SH, KCF, J-YS, DB, JYP, YCK, JPL, FD, HK and MLB contributed to the critical revision of the manuscript for important intellectual content. MB obtained funding, and provided administrative, technical, or material support. WL and MLB supervised the study. The corresponding author attests that all listed authors meet authorship criteria and that no others meeting the criteria have been omitted. Transparency: The lead author (the manuscript’s guarantor) affirms that the manuscript is an honest, accurate, and transparent account of the study being reported; that no important aspects of the study have been omitted; and that any discrepancies from the study as planned (and, if relevant, registered) have been explained.
Funding This paper was developed under Assistance Agreement No RD835871 awarded by the US Environmental Protection Agency to Yale University. It has not been formally reviewed by EPA. WL was supported by the 2020 Science and Technology Subsequent Generation Support Project (NRF-2021R1A6A3A03038675), implemented by the National Research Foundation of Korea.
Disclaimer The views expressed in this document are solely those of MB and other co-authors and do not necessarily reflect those of the Agency. EPA does not endorse any products or commercial services mentioned in this publication.
Competing interests Competing interests: All authors have completed the ICMJE uniform disclosure form at www.icmje.org/disclosure-of-interest/ and declare: support from the US Environmental Protection Agency and National Research Foundation of Korea for the submitted work; no financial relationships with any organisations that might have an interest in the submitted work in the previous three years; no other relationships or activities that could appear to have influenced the submitted work.
Provenance and peer review Not commissioned; externally peer reviewed.
Supplemental material This content has been supplied by the author(s). It has not been vetted by BMJ Publishing Group Limited (BMJ) and may not have been peer-reviewed. Any opinions or recommendations discussed are solely those of the author(s) and are not endorsed by BMJ. BMJ disclaims all liability and responsibility arising from any reliance placed on the content. Where the content includes any translated material, BMJ does not warrant the accuracy and reliability of the translations (including but not limited to local regulations, clinical guidelines, terminology, drug names and drug dosages), and is not responsible for any error and/or omissions arising from translation and adaptation or otherwise.